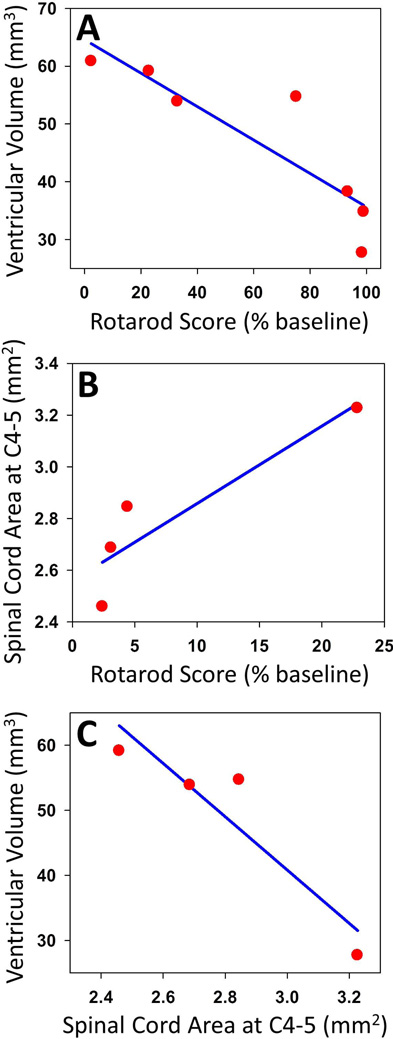
Figure 3. Correlation.
Pearson Product Moment Correlation was used to assess dependence. Brain atrophy showed a significant and strong negative correlation with functional disability throughout the observation period (A). Spinal cord atrophy showed a strong correlation with functional disability from months six through twelve (B). Brain atrophy from zero through six months showed a strong correlation with spinal cord atrophy from six through twelve months (C).

