
Extended Data Figure 6.
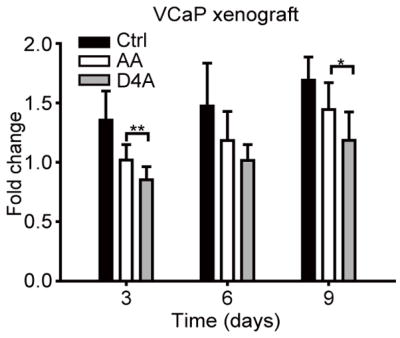
D4A impedes VCaP xenograft growth. * and ** denote P values < 0.05 and 0.01, respectively, for the difference between D4A (n = 10 mice) and AA (n = 10 mice) treatment groups. N = 9 mice for the control group.
Official websites use .gov
A
.gov website belongs to an official
government organization in the United States.
Secure .gov websites use HTTPS
A lock (
) or https:// means you've safely
connected to the .gov website. Share sensitive
information only on official, secure websites.
D4A impedes VCaP xenograft growth. * and ** denote P values < 0.05 and 0.01, respectively, for the difference between D4A (n = 10 mice) and AA (n = 10 mice) treatment groups. N = 9 mice for the control group.