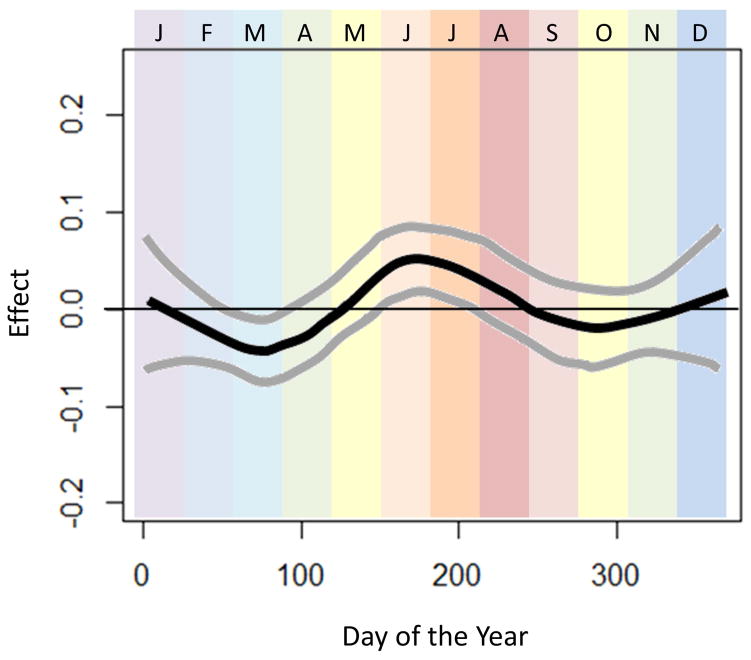
Figure 1.
Seasonal variation of esophageal eosinophilia. Adjusted associations between biopsy date and esophageal eosinophilia (adjusted for categorical age and sex) are presented. Day of the year is displayed across the horizontal-axis, with colored bands representing the month of the year. The vertical-axis displays the effect (log-odds) of day of the year on diagnosis of esophageal eosinophilia. Smoothed data were generated using the optimal degree of smoothing of the analysis including patients from all climate zones (n=104983; optimal span size=0.40). 95% confidence bands are displayed around each association.

