
Figure 3. Comparison of 6H5 mAb versus 6H5 mAx.
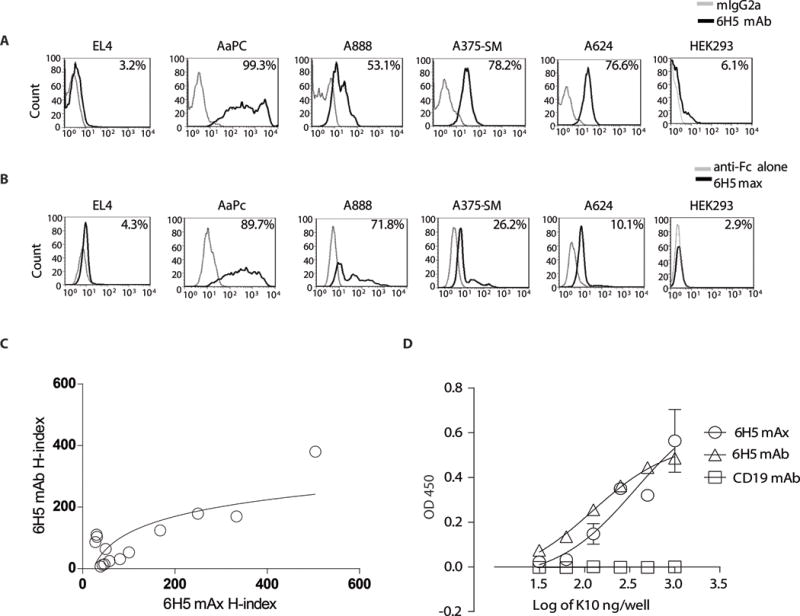
Histograms representing surface antigen expression of HERV-K env using (A) 6H5 mAb (black) and (B) 6H5 mAx (black). Isotype (grey) and secondary antibody (grey) were used as controls. (C) Correlation plot between tumor cell surface (A888, A624, A375, A375-SM, EL4) H-indices of 6H5 mAb or 6H5 mAx staining of tumor cells grown at three different time point with varying cell density (spearman correlation coefficient ρ = 0.5033, p = 0.067). (D) Binding of 6H5 mAx and 6H5 mAb to purified HERV-K env (K10) protein by ELISA. CD19 mAb was used as negative control. H-index was calculated as product of intensity of HERV-K env staining (MFI) on tumor cell surface and percent tumor cells positive for antigen expression. Data represents mean ± SD from triplicate measurements that were pooled from two independent experiments for ELISA experiments.