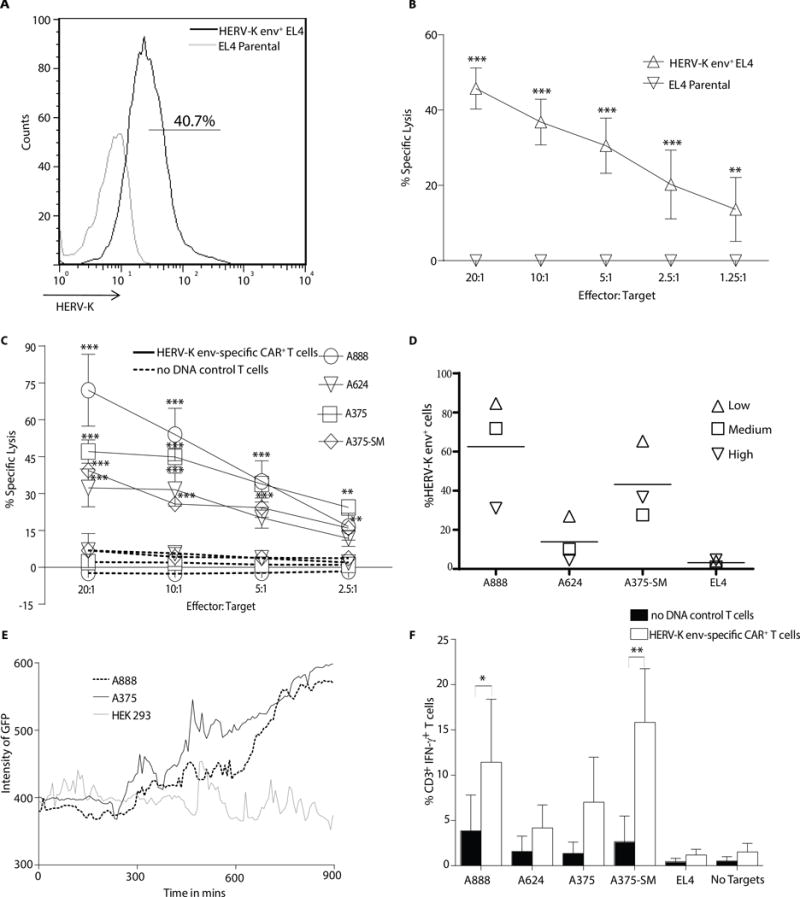
Figure 4. Redirected specificity of HERV-K env-specific CAR+ T cells.

(A) Representative flow plots (n = 3) of HERV-K env expression on EL4 cells transduced with HERV-K env antigen compared with HERV-K envneg EL4 parental. (B) A four hour chromium release assay (CRA) using HERV-K env-specific CAR+ T cells as effectors and either EL4 parental or HERV-K env+ EL4 cells as targets. (C) A 4 hour CRA of HERV-K env-specific CAR+ T cells (solid line) compared to no DNA control T cells (dotted lines) using melanoma tumor cells as targets. (D) Percentage expression of HERV-K env protein on tumor cell surface using 6H5 mAx. Each symbol represents a low (20%), medium (50%) and high (70%) confluence in the tissue culture flask (n = 3) and horizontal line the mean. (E) Video time-lapse microscopy (VTLM) to assess killing by HERV-K env-specific CAR+ T cells over a 15 hour period co-cultured at 5:1 ratio with A888, A375, or HEK293 target cells in media with SYTOX. Green cells in the FITC channel were recorded as dead cells and the intensity of the fluorescence was measured. Data represented as mean ± SD from 25 tumor cells pooled from two independent experiments. (F) IFN-γ production by CAR+ and CARneg T cells upon incubation with targets. Data represent mean ± SD from three healthy donors (average of triplicate measurements for each donor). Two way ANOVA with Bonferroni post-test was performed on CRA and IFN-γ production assay between the HERV-K env-specific CAR+ T cells and no DNA control cells *p < 0.05, **p < 0.01 and ***p < 0.001.
