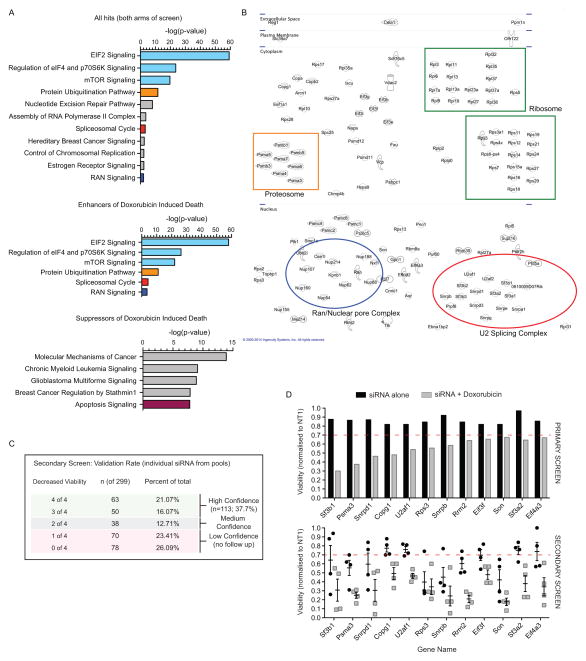
Figure 2. Protein translation and RNA splicing enhance OS cell death.
(A) Analysis of pathways enriched in the primary screen from both arms (+/− doxorubicin; upper panel), those enriched within hits that enhanced doxorubicin induced cell death (middle panel) and those that increased cell survival in the presence of doxorubicin (lower panel). Data plotted as log fold enrichment (p-value) based on Ingenuity Pathway Analysis. (B) Visualization of the individual candidate hits based on subcellular localization (from Ingenuity Pathway Analysis software) with specific pathways that are enriched indicated within each colored box based on n the validated primary screen results described in part A. (C) Secondary screen deconvolution analysis of the candidates identified in the primary screen. Primary screen candidates were secondarily screened as individual siRNAs and those with 3 or 4 of 4 validating the primary screen were considered high confidence candidates; 2 of 4 medium confidence and 1 or less not considered further. (D) Examples of individual target effects in the primary and secondary screen. Upper panel: mean viability of duplicate samples for each treatment arm from the primary siRNA screen; lower panel: viability following transfection of the individual siRNA validation for each target in the secondary screen. In the lower panel each point represents an individual siRNA from within the pooled complex used for the primary screen with mean ± SEM for each gene.

