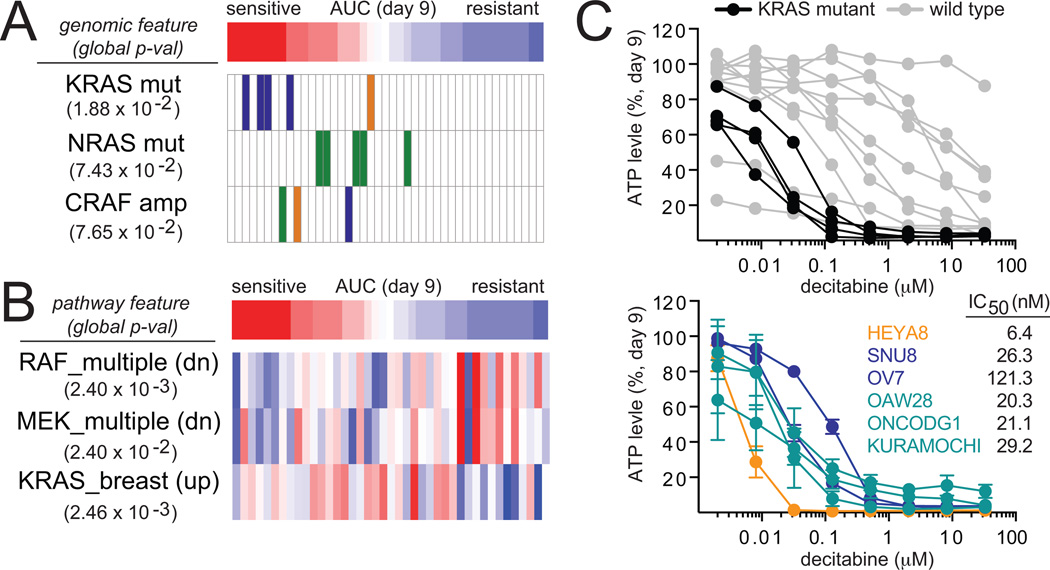
Figure 2.
KRAS genomic status predicts decitabine sensitivity in ovarian cancer cell lines. A, correlation analysis based on differential mutual information was used to correlate the cellular response of decitabine (nine-day treatment) with genomic features of ovarian (blue), melanoma (green) and breast (orange) cancer cell lines. B, correlation analysis based on differential mutual information was used to correlate the cellular response of decitabine (nine-day treatment) with pathway features as defined by gene sets with high gene expression (red) or low gene expression (blue). C, cell viability after nine days of treatment with decitabine are shown for the profiled KRAS-mutant (black) and wild-type (gray) ovarian cancer cell lines. Cell viability was measured in one additional KRAS-mutant low-grade serous ovarian cancer cell line (orange), two additional KRAS-mutant high-grade serous ovarian cancer cell lines (navy) and three additional KRAS-amplified high-grade serous ovarian cancer cell lines (teal). Data are representative of two independent experiments (14 replicates, mean ± SD).

