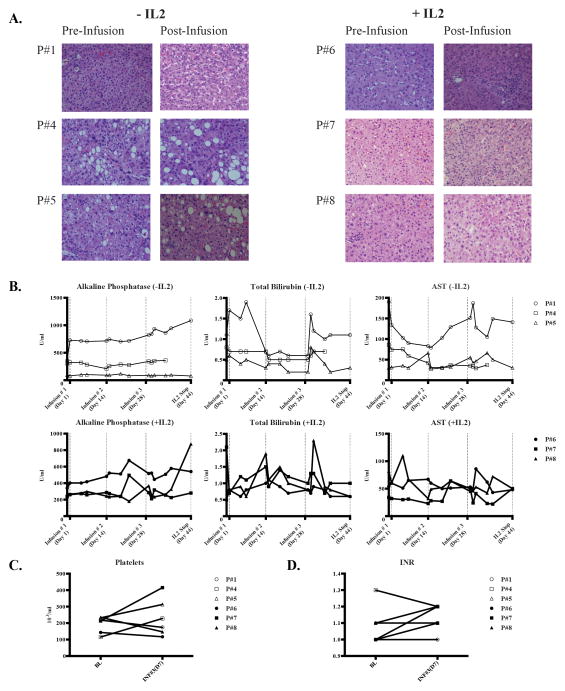
Figure 2. Assessment of liver inflammation and injury following anti-CEA CAR-T HAIs.
(A) Normal liver biopsies were obtained under CT guidance prior to the first infusion and just prior to the third infusion. Routine H&E staining is shown. (B) Alkaline phosphatase, total bilirubin, and aspartate aminotransferase levels are shown for the patients who did not or did receive systemic IL2. Dotted vertical lines indicate CAR-T infusion time points and the first data point represents the baseline value prior to CAR-T infusion. Platelet counts (C) and INR values (D) for each patient are shown.

