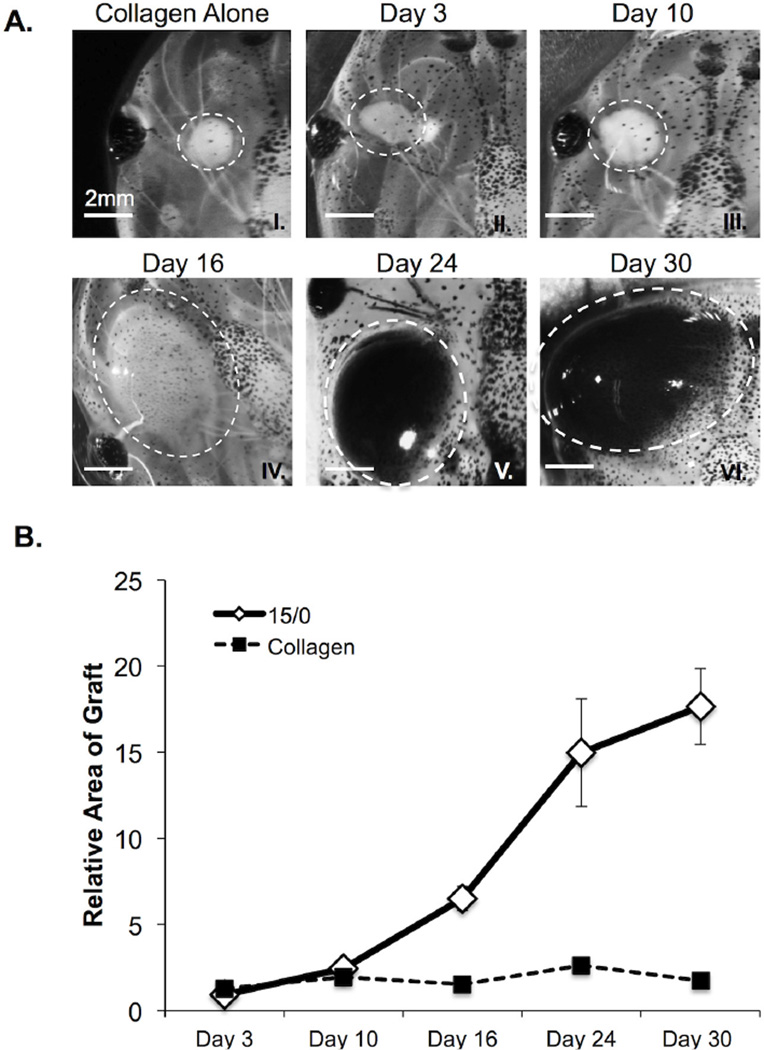
Figure 1. In vivo growth of 15/0 semi-solid tumor grafts.
(A) Representative images of collagen alone (I) and 15/0 tumor grafts (dashed white line) at day 3, 10, 16, 24 and 30 following engraftment (II–VI). Note the accumulation of melanophores in the tumor grafts at later time points. (B) Average increase in area ±SEM of tumor or collagen only grafts determined over time relative to collagen only graft at day 0. Values are expressed as the mean ± SEM from 15 animals in 3 independent experiments. P values calculated using students TTEST. LG-15, stage 54 (2 week old) tadpoles were subcutaneously grafted with 500,000 cells of 15/0 tumor while control animals were grafted with equal volume of collagen alone. Animals were imaged on a Nikon SMZ1500 stereomicroscope.

