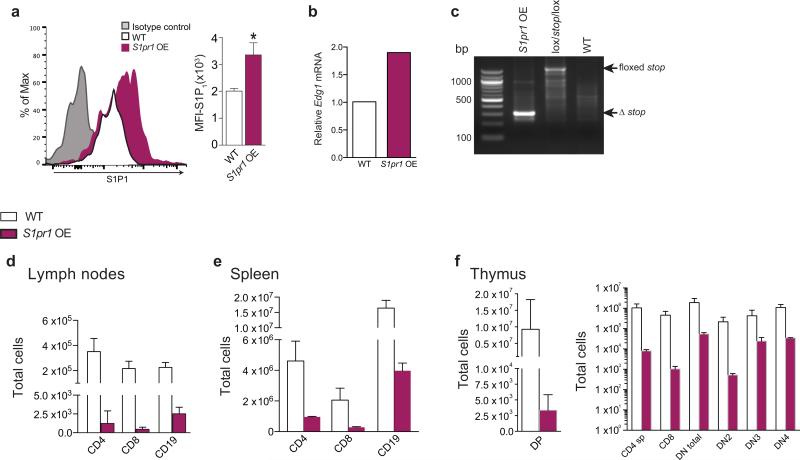
Extended Data Fig 7. Over-expression of S1P1 results in marked decreases in lymphocyte populations in the thymus and secondary lymphoid organs.
a, Representative flow cytometry plots and quantitative MFI of S1P1 expression by Lin− cells from S1pr1 OE and WT littermates. n = 3. b, Relative expression levels of S1pr1 mRNA in bone marrow cells of S1pr1 OE mice relative to WT mice, as determined by multiplex qRT-PCR. c, Representative agarose gel of Cre activation and excision of the floxedsStop cassette as assessed by PCR of genomic DNA from bone marrow cells of S1pr1 OE, lox/stop/lox littermate, or WT littermate. Arrows indicate amplified DNA fragments corresponding to undeleted or deleted segments
Four days after the final dose of tamoxifen, CD4+, CD8+, and CD19+ cells in (d) brachial and inguinal lymph nodes and (e) spleen, and (f) thymic CD4+CD8+ double positive (DP), CD4 and CD8 single positive (CD4 or CD8 sp), total double negative (DN), and double negative subpopulations DN2, DN3, and DN4 were quantified by flow cytometry in S1pr1 OE mice and WT littermates. Bars represent means ± SD; S1pr1 OE, n = 6; WT, n = 7 and data are compiled from two experiments.

