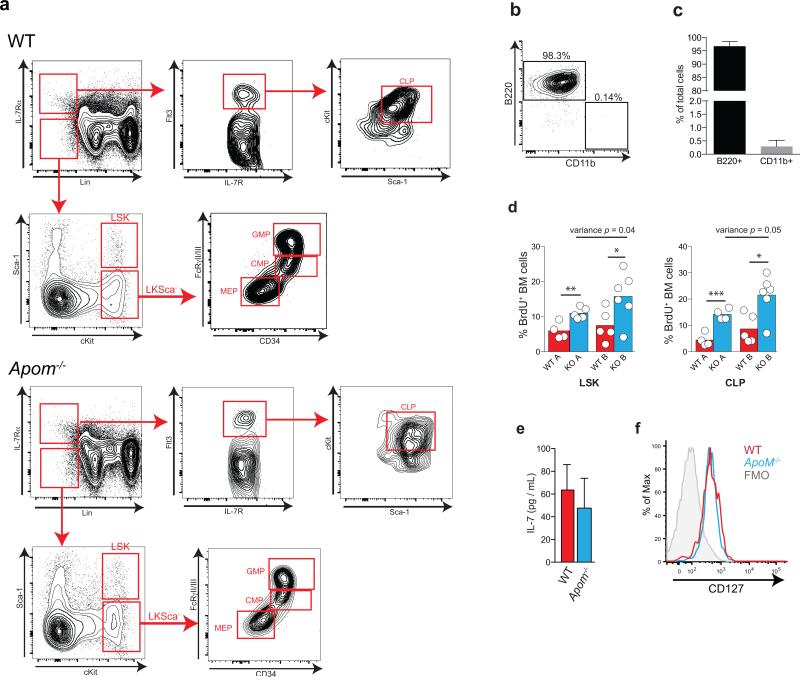
Extended Data Fig 5. Multiparameter flow cytometry gating scheme for determination of CLP and other bone marrow populations.
a, Cells are first gated as Lineage (Lin−) and IL-7Rα+. Cells are then gated by Flt3 (Flk2/CD135) versus IL-7Rα expression, then further gated by cKit versus Sca1 expression to define common lymphoid progenitors (CLP). Representative staining examples of WT (top) or Apom−/− (bottom) BM cells are shown. b, Representative flow cytometric plot and c, quantitation of B220+CD11b− and CD11b+B220− cells generated from CLP in vitro. CLP, gated according to the gating hierarchy shown in (a), were sorted from BM of WT mice and incubated in methylcellulose medium containing growth factors to support both lymphoid and myeloid lineage development. Cells were analyzed for B220 and CD11b expression after 12d of culture. n = 6. d, Percent BrdU incorporation by LSK (left) or CLP (right) in BM of WT (red) or Apom−/− (blue) mice in two independent experiments (A and B). *p < 0.05 versus WT; **p = 0.006 versus WT; ***p = 0.0009 versus WT. Equality of variance was determined by an F test. Bars represent means and circles represent values obtained from individual mice. e, IL-7 protein in bone marrow supernatants from WT and Apom−/− mice were quantified by ELISA. n = 6 combined from two studies. Bars represent mean ± SD. f, Representative histogram of IL-7Rα (CD127) expression on the surface of WT (red) or Apom−/− (blue) CLP. The fluorescence minus one (FMO) control is represented by the grey filled histogram.

