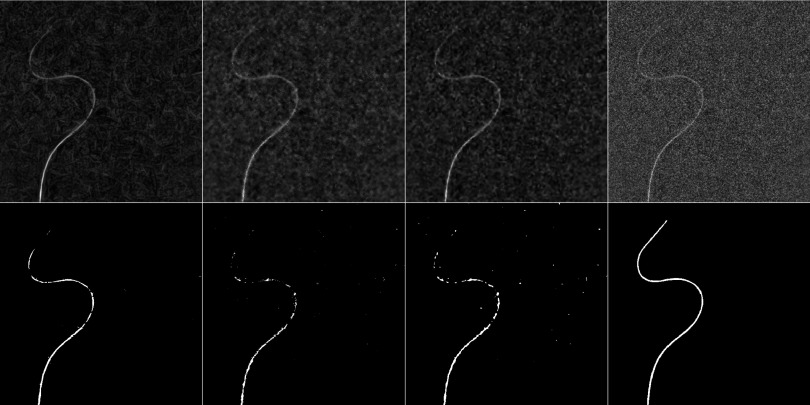
FIG. 7.
First row shows the filtered images of a 0.035 in. guidewire from an AP view at 15 nGy/pulse using the directional filter, bilateral filter, and wavelet soft thresholding (from left to right). The last image shows the original noisy image. The second row shows the results of the segmentation after applying the respective filters in the same order and the reference segmentation, obtained by averaging multiple frames of the acquired fluoroscopic image sequence in the last column.

