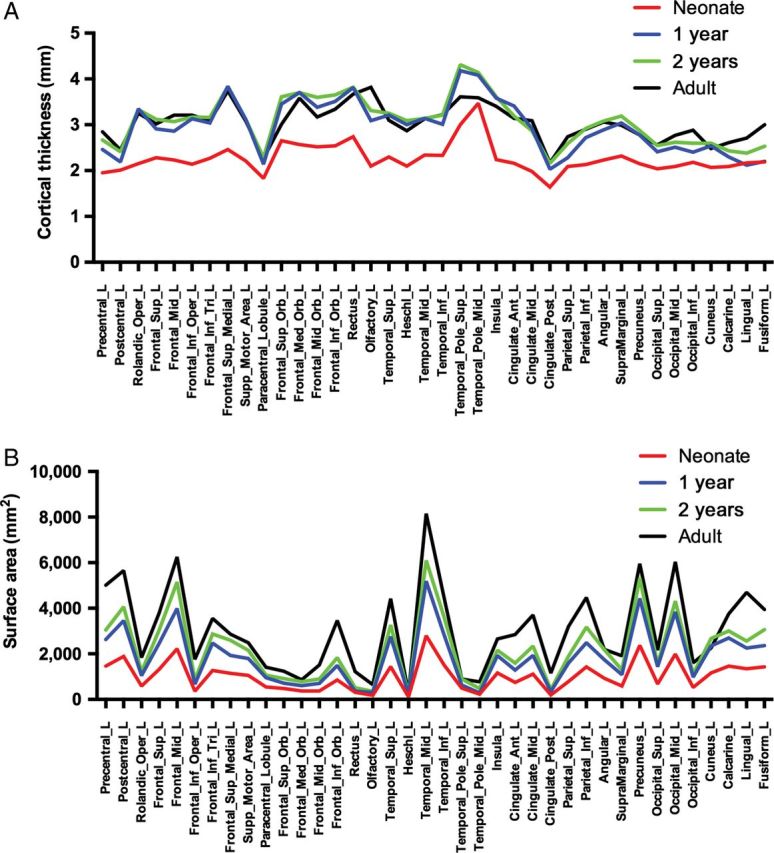
Figure 1.

Regional growth of CT and SA over time. (A) CT anatomical LS means at neonate (blue), 1 year (red), 2 years (green), and adult (black); (B) SA anatomical LS means at neonate (blue), 1 year (red), 2 years (green), and adult (black). Only left hemispheric ROIs are shown; ROIs for both CT and SA exhibited symmetry. Quantitative results can be found in Supplementary Table 2 (CT), Supplementary Table 4 (SA), Supplementary Table 8 (Adult CT), and Supplementary Table 9 (Adult SA). (Note: SA values are determined by the size of the ROI as defined by the parcellation atlas).
