
Figure 3.
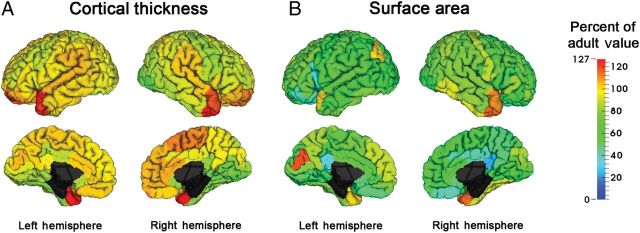
Comparison of 2 year old to adult cortical surface measure values. Percent of adult values for CT (A) and SA (B). For each ROI, we calculated the percent of adult value at 2 years of age. Warmer colors indicate larger percent of adult values than cooler colors. Quantitative results can be found in Supplementary Tables 8 and 9.