
Figure 4.
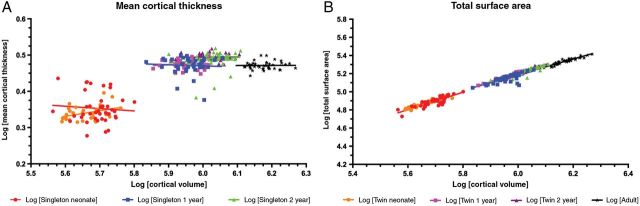
Relationship of CT and SA to cortical volume. Raw data values for each cohort are plotted at each time point. (A) The log–log relationship of mean CT to cortical volume is shown for neonate singletons (red), neonate twins (orange), 1-year singletons (blue), 1-year twins (pink), 2-year singletons (green), 2-year twins (purple), and adults (black). Regression analysis r2 values at neonate (singleton: r2 = 0.0061; twin: r2 = 0.1327), 1 year (singleton: r2 = 0.0033; twin: r2 = 0.0099), 2 years (singleton: r2 = 0.0196; twin: r2 = 0.0001), as well as in the adult cohort (r2 = 5.98E−5) are not significantly different from zero. (B) The log–log relationship of total cortical SA to cortical volume is shown for neonate singletons (red), neonate twins (orange), 1-year singletons (blue), 1-year twins (pink), 2-year singletons (green), 2-year twins (purple), and adults (black). Linear regression r2 values at neonate (singleton r2 = 0.7177; twin r2 = 0.8691), 1 year (singleton r2 = 0.5924; twin r2 = 0.9324), 2 years (singleton r2 = 0.8395; twin r2 = 0.9558), and adult (r2 = 0.8907) are each significantly different from zero (P < 0.0001).