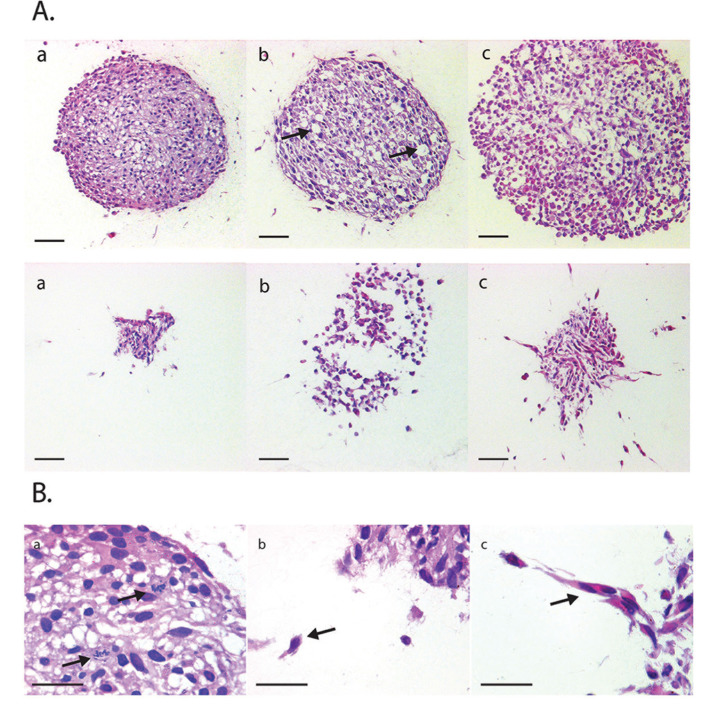
Figure 3. H&E stained sections of FFPE spheroids treated with anti-invasion agents.
(A) Top row: U87 spheroids, untreated (a), 20 mM LiCl (b) and 5μM BIO (c). Scale bar= 100 μM. Bottom row: U251, untreated (a), 20mM LiCl (b) and 5 μM BIO (c). Scale bar = 50 μM. (B) Representative images of mitotic figures visible in stained spheroid (a) and morphological differences between invading cells in untreated U251 spheroid (b) compared to BIO-treated U251 spheroid (c). x40 magnification. Arrows indicate mitotic features in (a) and migrating cells in (b) and (c).

