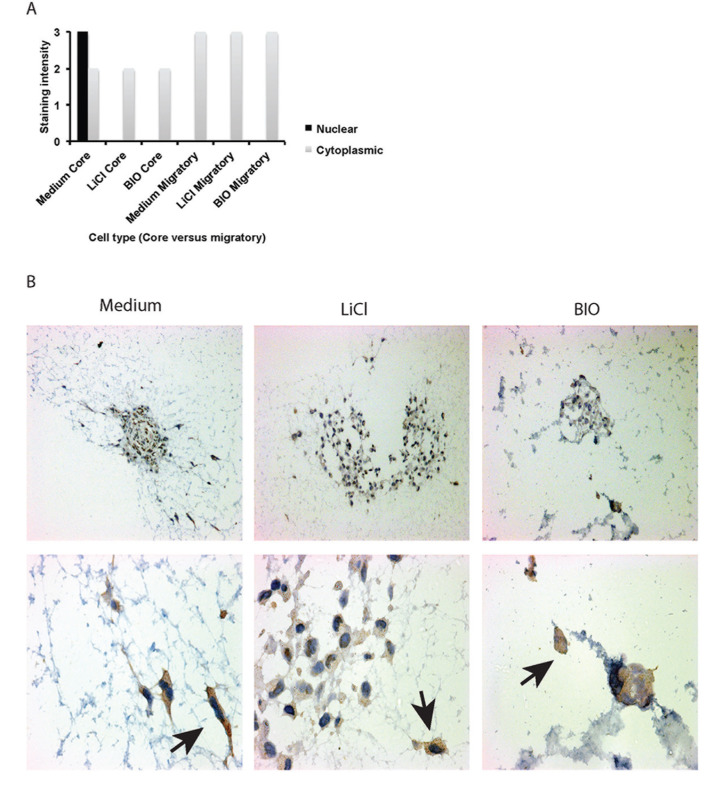
Figure 5. FFPE sections of U251 spheroids displaying differential staining intensities in cells contained within the core and migratory cells after treatment.
(A) Graphic illustration of staining patterns and intensities observed for SOX-2 expression in core maintained cells and migratory cells. (B) SOX-2 antigen staining in spheroid core cells and migratory cells after no treatment (Medium), 20 mM LiCl, 5 μM BIO, x10 magnification. Corresponding images at x40 magnification show SOX-2 expression in invading cells and cells maintained within the core with treated specimens (bottom row). In treated cells SOX-2 levels are higher in migratory cells than in the cells maintained within the core.

