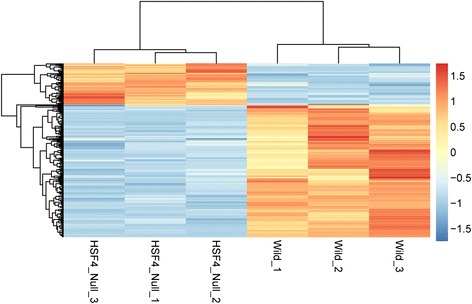
Fig. 1.

The hierarchical clustering diagram of mRNA expression. Each column corresponds to a single microarray whereas each row indicates expression profile of a single gene. Red and blue stand for high and low values in the mRNA expression, respectively. The expression value from low to high was showed by gradient of blue to red
