Fig. 3.

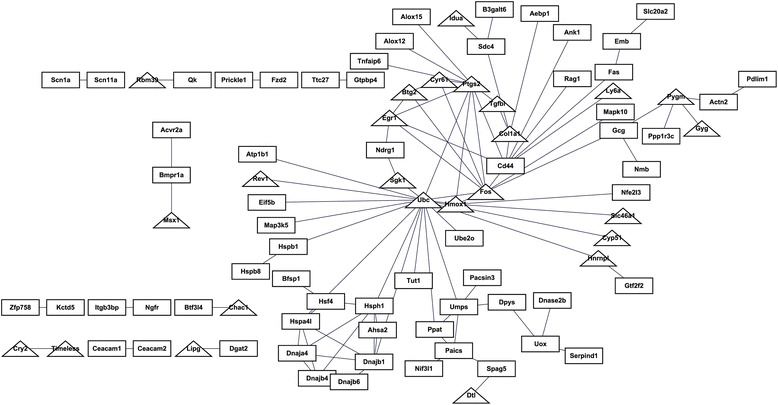
The protein-protein interaction network of differentially expressed genes (DEGs). The triangles and rectangles indicate up- and down-regulated DEGs, respectively

The protein-protein interaction network of differentially expressed genes (DEGs). The triangles and rectangles indicate up- and down-regulated DEGs, respectively