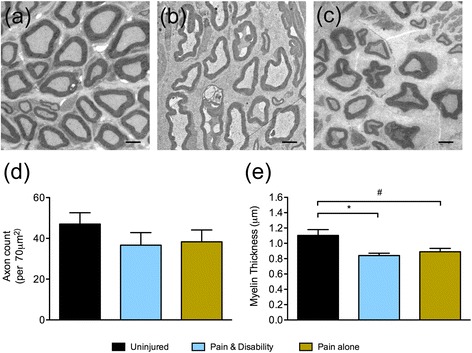
Fig. 2.

Representative electron micrographs of axons located 1 mm proximal to the injury site six days after CCI from a uninjured, b Pain and disability and c Pain alone rats. Scale bars represent 2 μm. d The mean axon count per 70 μm2 field of view, and e The mean myelin thickness of 100 axons from uninjured controls (n = 4), as well as from Pain alone and Pain and disability rats (n = 5 per group). Significant differences compared to uninjured controls are indicated by *P <0.05 for Pain and disability and # P <0.05 for Pain alone
