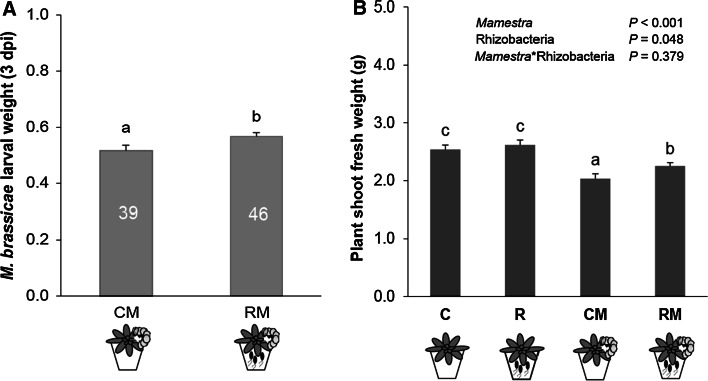
Fig. 2.
a Body mass (mean ± SE) of caterpillars feeding on the sets of plants from the olfactometer assays for 3 days. CM control plants, RM rhizobacteria-treated plants. Three neonatal larvae were placed on each plant and a set of four plants was used in each experiment. Numbers inside each bar represent the number of larvae surviving on the day of weight assessment. Different letters above bars indicate significant differences between treatments (LMM, P < 0.05, LSD test). b Plant shoot fresh weight (mean ± SE) of control plants (C), rhizobacteria-treated plants (R), control (CM), or rhizobacteria-treated plants infested with M. brassicae for 6 days (RM). Different letters above bars indicate a significant difference between treatments (two-way ANOVA, N = 12–15 plants, P < 0.05, LSD test)

