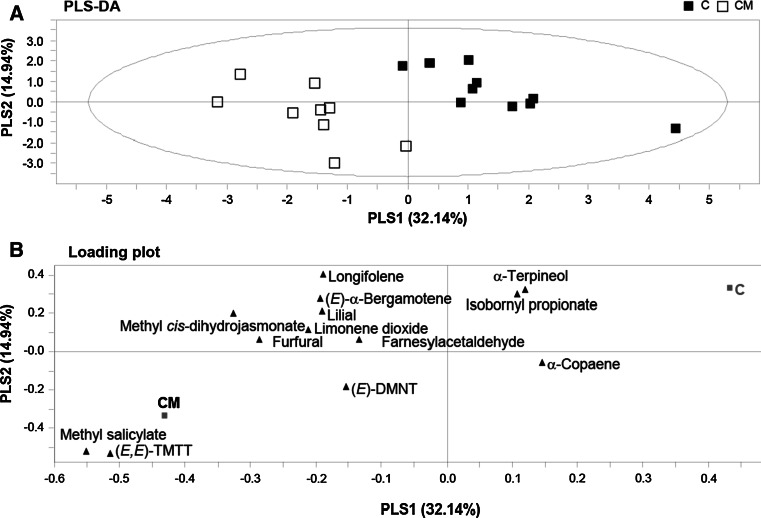
Fig. 3.
Projection to latent structures discriminant analysis (PLS-DA) comparing volatile blends from control plants (C) versus control plants infested with Mamestra brassicae (CM) for 3 days before volatile collection. a Grouping pattern of samples according to the first two principal components and Hotelling’s ellipse of the 95 % confidence interval for the observations. Each point represents one sample (N = 9–10 replicates). b Loading plot of the first two components of the PLS-DA, showing the contribution of each volatile compound to the separation of the two treatments

