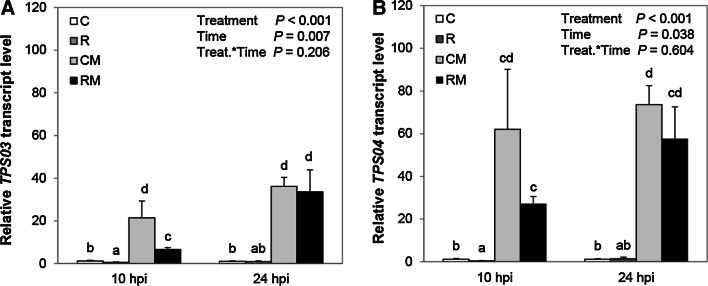
Fig. 6.
Relative transcript levels (mean ± SE) of TPS03 and TPS04 in local leaves of control plants (C), rhizobacteria-treated plants (R), control plants infested with M. brassicae (CM), or rhizobacteria-treated plants infested with M. brassicae (RM) for 10 and 24 h post-infestation (hpi). Transcript levels were normalized relative to the reference genes EF1α and FBOX and measured relative to the control plants (N = 5 replicates, each from a pool of 3 plants). Different letters above bars indicate a significant difference between treatments (two-way ANOVA, P < 0.05, LSD test)

