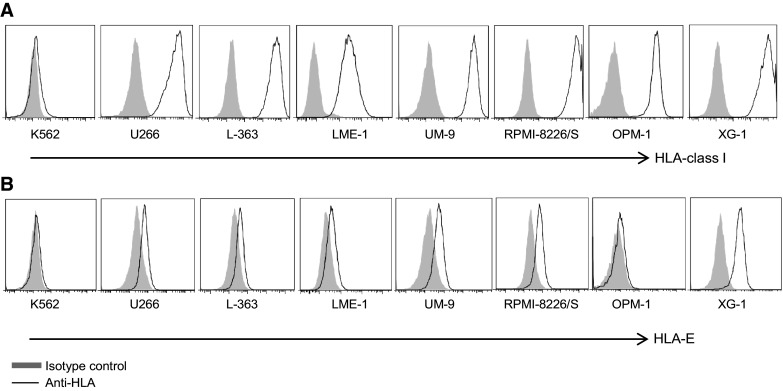
Fig. 2.

Myeloma cell lines express high levels of HLA-class I and heterogeneous levels of HLA-E. HLA-class I a and HLA-E b surface expression of HLA-class I-deficient K562, and seven myeloma cell lines (U266, L-363, LME-1, UM-9, RPMI-8226/S, OPM-1, XG-1) was determined by flow cytometry. Histograms are representative of three different measurements. HLA expression is depicted by open histograms and matched isotype controls by gray histograms
