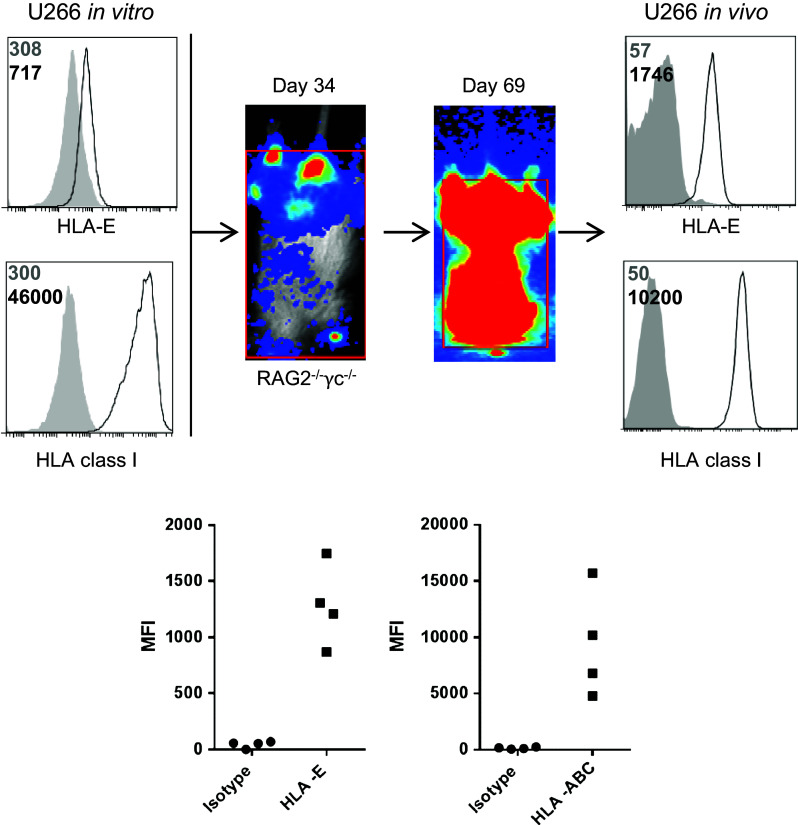
Fig. 3.
In vivo grown U266 myeloma cells have a higher HLA-E expression than in vitro cultured U266 cells. 5*106 U266 cells were injected in RAG-2−/− γc−/− immunodeficient mice. Tumor growth was monitored at multiple time points after injection by bioluminescent imaging. Once the human endpoint was reached, mice were killed and the bone marrow was harvested and stained for HLA-class I and HLA–E. U266 cells grown in vitro were also stained for HLA-class I and HLA-E. HLA expression was analyzed by flow cytometry. Representative histograms are shown of HLA expression (open histograms) and matched isotype controls (gray histograms). Numbers in the histograms depict MFI of the isotype control (gray) or HLA (black). Graphs show MFIs obtained from histograms of in vivo HLA expression. Each dot represents one mouse

