Fig. 4.
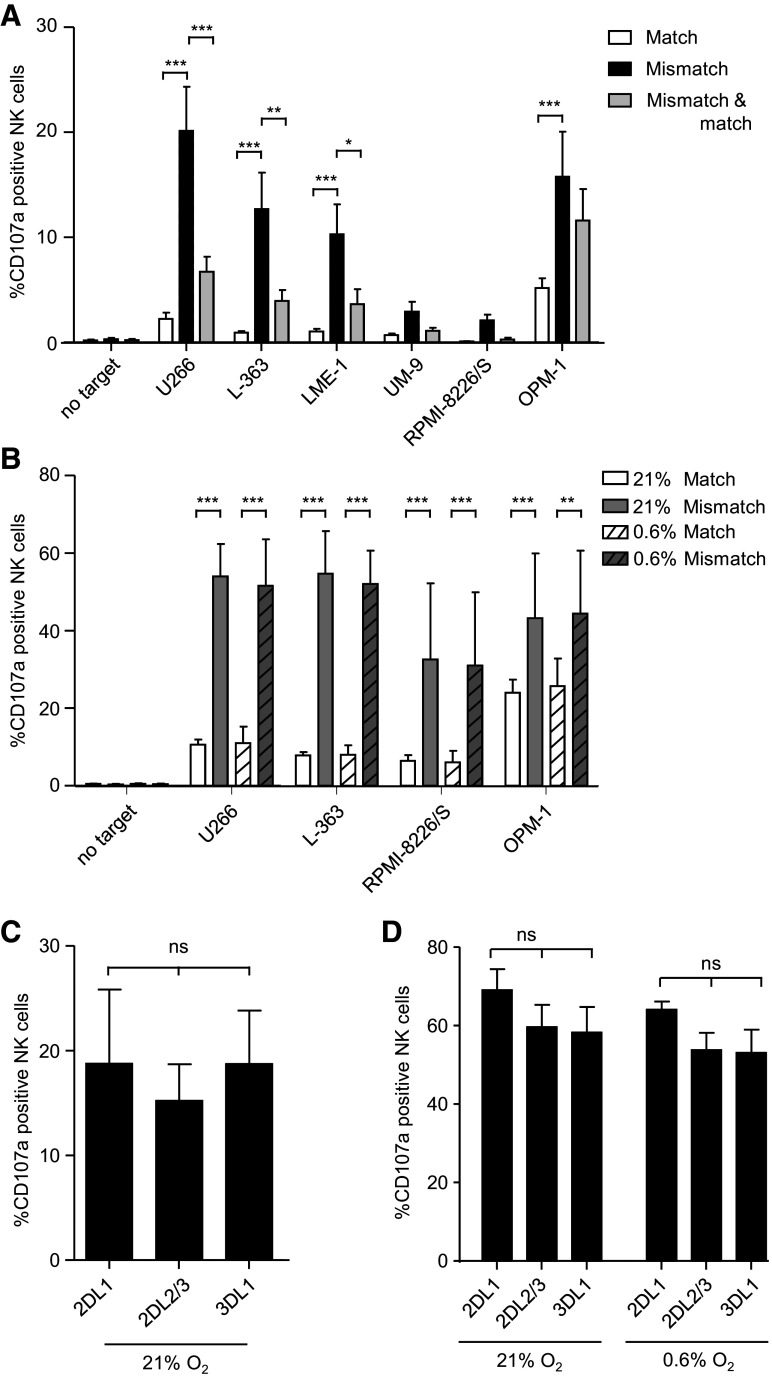
KIR–ligand-mismatched NK cell subsets mediate the most effective anti-myeloma response. a Six myeloma cell lines were co-cultured with NK cells isolated from peripheral blood in the presence of anti-CD107a at 21 % of oxygen. After 12 h, cells were stained for KIRs and NKG2A and degranulation (CD107a+) was measured by flow cytometry. For analysis, NK cells (CD3-CD56+) were subdivided into 16 subpopulations based on their expression of different inhibitory receptors and the percentage of CD107a+ cells per subset was analyzed. Next, the 16 populations were categorized into three subgroups: KIR–ligand-matched NK cells (white bars), KIR–ligand-mismatched NK cells (black bars) and NK cells with a co-expression of KIR–ligand-mismatched and matched cells (gray bars). This was done per myeloma cell line based on the HLA genotype of the cell line. For all subsets, NKG2A+ NK cells were excluded from the analysis. Graph shows mean percentage and SEM of CD107a+ NK cells for each of these subgroups. b Myeloma cell lines were pre-incubated for 6 h at 21 % or 0.6 % O2. NK cells were activated for 6 h with 1000 U/ml IL-2 at 21 % of oxygen. After 6 h, NK cells and myeloma cells were co-cultured for an additional 10 h at 21 % or 0.6 % O2. Analysis of degranulation of IL-2-activated NK cells subsets was performed as described under a. Graph shows mean percentage and SEM of CD107a+ NK cells, for NK cells exclusively expressing matched (white bars) or mismatched KIRs (gray bars) at 21 % O2 (open bars) or 0.6 % O2 (dashed bars). Unactivated NK cells (c) or activated NK cells (d) were co-cultured with K562 as described in a and b. Graphs in c and d show mean percentage and SEM of CD107a+ NK cells for subsets exclusively expressing KIR2DL1 or KIR2DL2/3 or KIR3DL1. Experiments in a and c were performed in the same assay in duplicate cultures for n = 4 healthy donors. Experiments in b and d were performed in the same assay in duplicate cultures for n = 5 donors. *p < 0.05, **p < 0.01, ***p < 0.001

