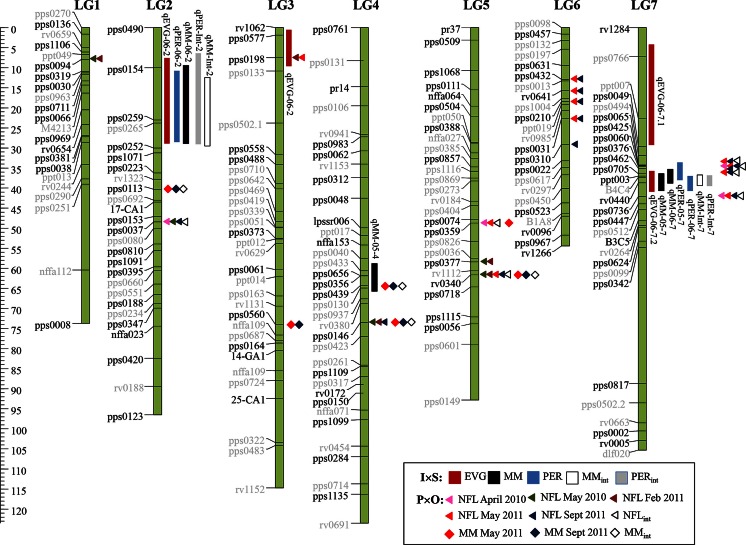
Fig. 1.
MQM QTL positions for endophyte mycelial mass (MM), peramine (PER) and ergovaline (EGV) measured in 2005, 2006 and calculated across both years (MMint and PERint) on a genetic linkage map developed for F 1 perennial ryegrass mapping population I × S. QTL 2-LOD confidence intervals are indicated by blocks at right of the linkage groups (QTL names as per Table 3). Locations of SSR loci (triangle and diamond symbols) associated by Kruskal–Wallis analysis with MM (diamond symbols) and N-formylloline (NFL, triangle symbols) in population P × O are also shown for individual months and calculated across months (MMint and NFLint). Marker names are shown at left of linkage groups. Marker names in black were polymorphic in population P × O. The length of linkage groups in centimorgan (cM) is indicated by the scale at the left of the figure

