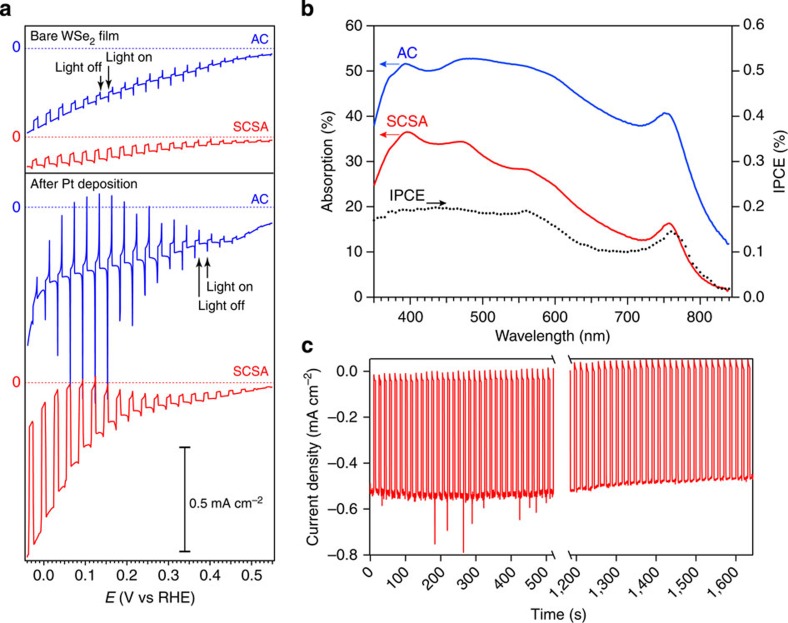
Figure 4. Photoelectrochemical characterization of the WSe2 thin films prepared by the SCSA and AC techniques.
(a) shows the linear scanning voltammetry (LSV) curves under intermittent illumination (1 sun, 100 mW cm–2) for the bare films (top) and after Pt deposition (bottom). A horizontal axis corresponding to zero current is indicated for each curve. The incident-photon-to-current (IPCE) spectrum for the SCSA film is shown together with the optical absorptivity in b. (c) shows the chronoamperometric scan (at 0 V versus RHE) for the SCSA electrode under intermittent illumination.

