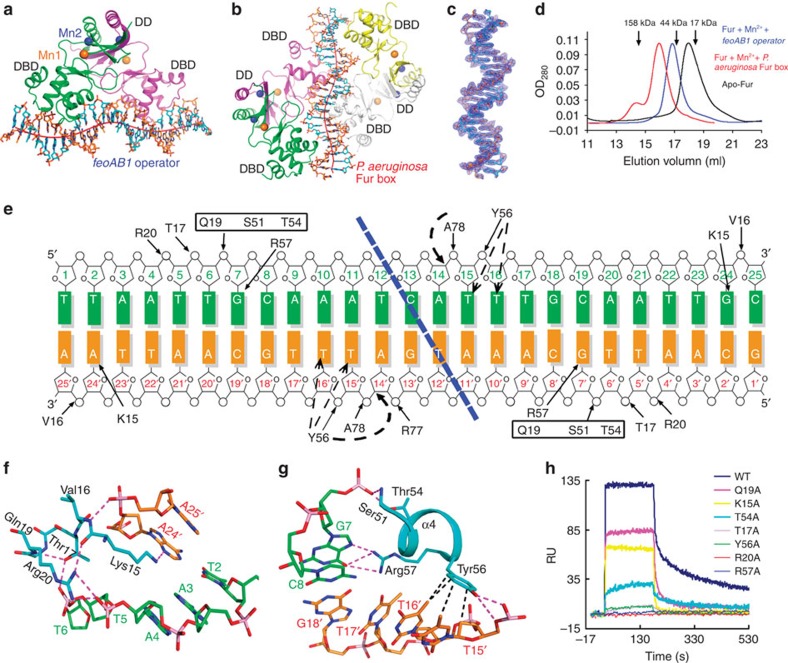
Figure 4. Structures of the Fur-Mn2+–DNA ternary complex.
Overall structures of the feoAB1 operator in complex with two Fur monomers (a) and the P. aeruginosa Fur box in complex with four Fur monomers (b). Fur is coloured by subunit. The DNA helical axis calculated with CURVES (see Methods) is shown as a red tube. Fur conformations are almost the same in these complex structures. (c) 2Fo−Fc electron density map (1.0 σ) of the bound P. aeruginosa Fur box. (d) Analytical gel filtration profiles of apo-Fur, and Fur in complex with different DNA fragments in the presence of Mn2+. Elution volumes of the molecular mass standards are marked at the top of the panel. (e) Schematic diagram summarizing the Fur–feoAB1 operator interactions. Solid and dashed arrows indicate hydrogen bonding and van der Waals interactions, respectively. Dashed blue line indicates the boundary between nucleic acids bound by the two monomers. A close-up view of the interactions of loop 1 (L1) with the minor groove (f) and contacts between the α4 helix and the major groove (g). Dashed magenta lines indicate hydrogen bonding, and dashed black lines indicate van der Waals interactions. (h) Overlay plot of subtracted sensorgrams generated with binding of WT or mutant Fur protein (2 μM) to the feoAB1 operator determined by SPR. K15A and Y56A mutants showed weak binding, whereas no binding of R57A mutants was detected.

