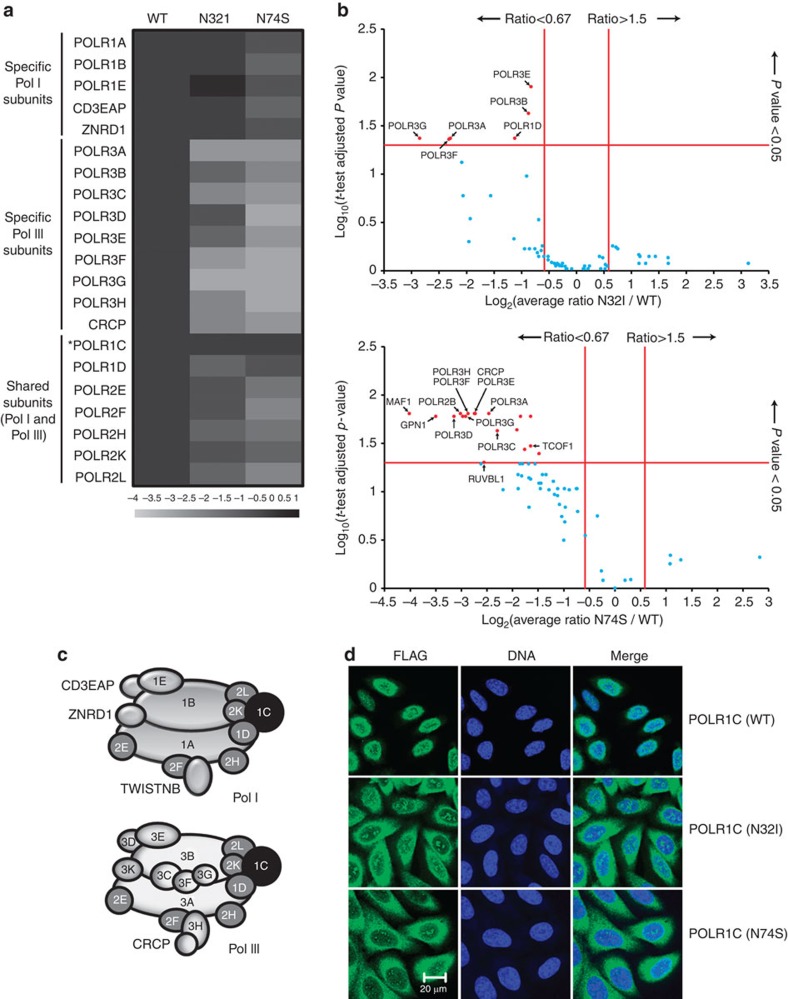
Figure 3. Impact of POLR1C mutations on polymerase assembly and nuclear import.
(a) FLAG-tagged POLR1C variants, either the wild-type (1C) polypeptide or mutated versions having a N32I or a N74S substitution, were expressed in HeLa cells and purified using anti-FLAG affinity chromatography. The co-purified proteins were identified using LC-MS/MS mass spectrometry. The heatmap contains the log2-transformed average spectral count ratios N32I or N74S/WT across all three replicates. Spectral counts were computed with Mascot (see Supplementary Table 6 for the complete data set). Specific and shared POLR1 (Pol I) and POLR3 (Pol III) subunits are identified on the left. POLR1C (the bait) is identified by an asterisk. (b) Volcano plots of the log2-transformed average spectral count ratios N32I or N74S/WT (x axis) and the –log10-transformed P values (adjusted with the Benjamini–Hochberg procedure) resulting from the two-tailed one-sample t-tests of the high-confidence interactors of POLR1C. Red proteins show a level of differential interaction with POLR1C that is statistically significant, while blue proteins do not. (c) Schematic representation of the subunit composition of POLR1 (Pol I) and POLR3 (Pol III; see refs 53 for details). Shared subunits are in grey and POLR1C in black. (d) Immunofluorescence experiments showing the cellular localization of tagged POLR1C variants. Nuclei are stained using TO-PRO-3 iodine. Scale bar, 20 μm.

