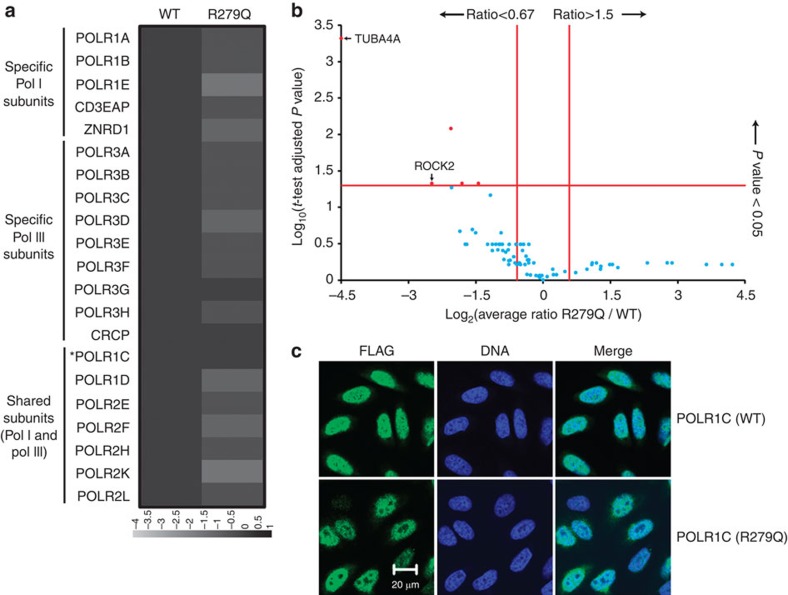
Figure 5. Impact of a TCS-causative mutation in POLR1C on polymerase assembly and cellular localization.
FLAG-tagged POLR1C variants, either the wild type (1C) or a mutated version with the R279Q substitution, were expressed, affinity-purified and used in anti-FLAG immunofluorescence experiments as in Fig. 3. (a) Affinity purification coupled to mass spectrometry data is represented in the form of a heatmap that contains the log2-transformed average spectral count ratios R279Q/WT across all three replicates. Spectral counts were computed with Mascot (see legend to Fig. 3 for details). (b) Volcano plot of the log2-transformed average spectral count ratios N279Q/WT (x axis) and the –log10-transformed P-values (adjusted with the Benjamini–Hochberg procedure) resulting from the two-tailed one-sample t-tests of the high-confidence interactors of POLR1C. Red proteins show a level of differential interaction with POLR1C that is statistically significant, while blue proteins do not. Proteins with a log2-transformed average spectral count ratio <−4.5 were capped to −4.5 for display purposes. (c) Immunofluorescence data showing the cellular localization of tagged POLR1C variants are shown. Scale bar, 20 μm.

