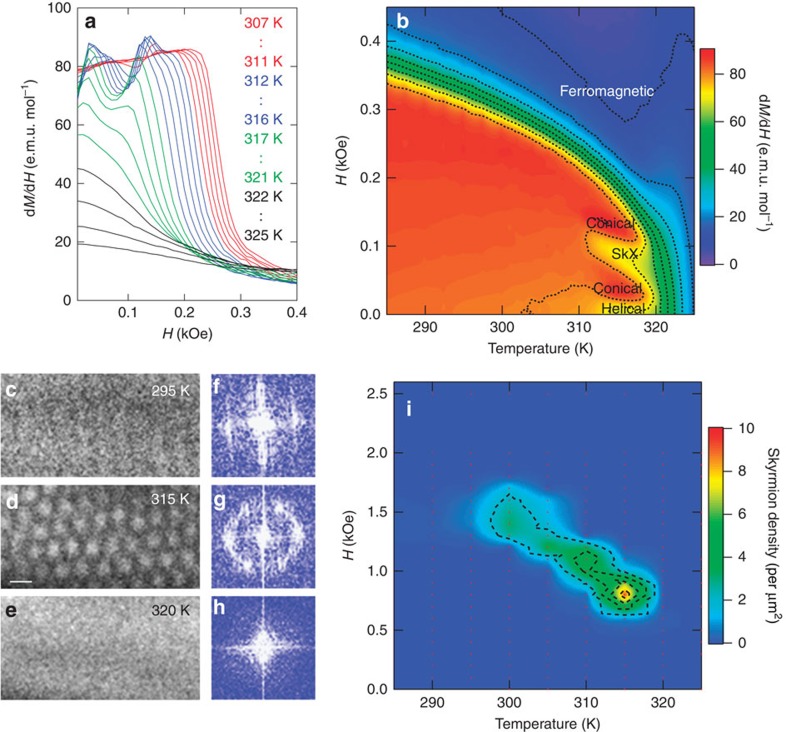
Figure 3. Magnetic phase diagrams of bulk and thin-plate forms.
(a) Temperature dependence of isothermal dM/dH versus H curves for a polycrystalline piece of Co8Zn9Mn3. (b) Magnetic phase diagram of the bulk sample in magnetic field versus temperature plane as deduced from dM/dH curves. (c–e) LTEM images on (111) plane of Co8Zn9Mn3 taken with under-focused condition in H=0.7 kOe applied normal to the plane at (c) T=295 K, (d) 315 K and (e) 320 K, respectively. (d) Scale bar, 200 nm. (f), (g) and (h) are Fourier transforms of the LTEM images c, d and e respectively. (i) Contour plot of skyrmion density of the Co8Zn9Mn3 (111)-thin plate in H versus T plane as deduced from LTEM observations obtained by counting the number of skyrmions in the area of ∼120 μm2 at each temperature and magnetic field. Some regions within the area contained dense SkX as in image d but other regions did not, making the average density smaller than expected from the image d. In the present bulk magnetization measurement, demagnetization factor (N) is ∼0.1 from the sample shape, whereas N∼1 in the thin-plate form for LTEM observation. Taking the magnitude of the magnetization in this sample into consideration, it explains factor of 7–8 difference in the threshold external magnetic field for formation of the SkX phase in the bulk form (b) and thin-plate form (i).

