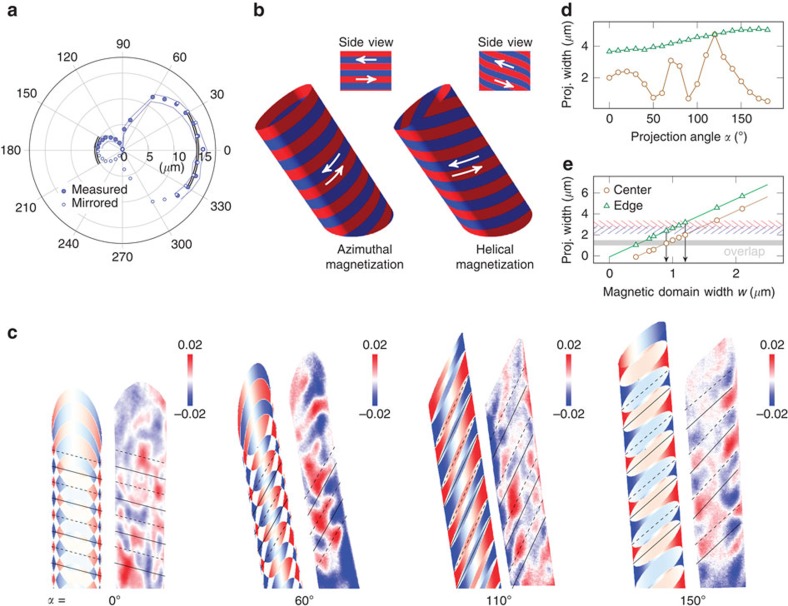
Figure 3. Correlation between simulated and experimentally observed XMCD contrast.
(a) Angle dependence of the projected ellipse axis along the beam when illuminating at 74° with respect to the surface normal in XPEEM to precisely determine the tube orientation. For 0° and 180°, the tube is tilted towards and away from the beam, respectively. The double lines indicate the analytically calculated periphery. (b) Modelled magnetization textures within the rolled-up nickel nanomembrane approximated as hollow tube. Tube geometry is taken from experiment; domain width is w=1 μm. (c) Correlation of experimental with simulated XMCD contrast of alternating domain widths (0.9 and 1.2 μm (11% and 15% the major axis)) at different projection angles. The projections reveal distinct and complex patterns that can only be assigned by simulation correlation to the corresponding magnetization textures. Solid lines serve as guide to the eye. (d) Angle dependence of the projected width shown for 1.7-μm wide magnetic domains. (e) Linear dependence of the projected width on the magnetic domain width of an azimuthal magnetization texture at the center line and the edge for α=110°. Experimental data (indicated shaded areas) suggests that the domain width is periodically alternating.

