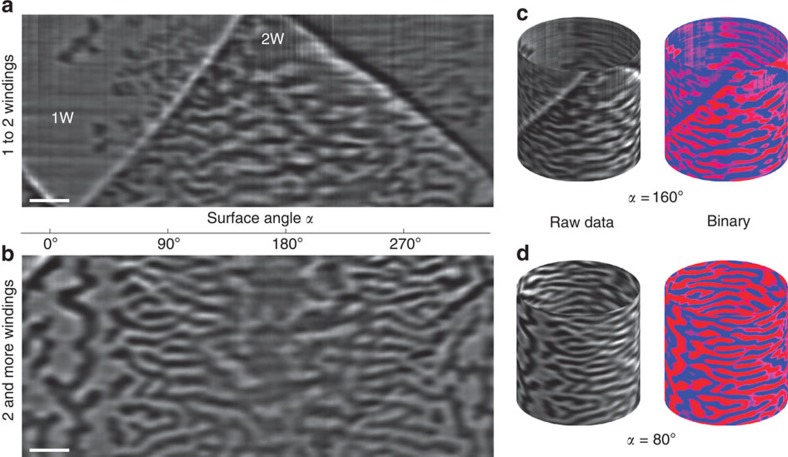
Figure 5. 3D reconstruction of the magnetization.
(a,b) Depict the unrolled magnetic domain patterns for better visualization. The transition from large isotropic to small azimuthal domains is obvious when approaching surfaces perpendicular to the initially applied magnetic field direction (0°). Dark and bright contrast refer to a magnetization pointing outside and inside the tube, respectively. Regions with one and two windings are indicated by 1 and 2 W, respectively. Scale bars, 500 nm. (c,d) 3D view of the magnetization in the tubular surfaces. In addition to the raw data (grayscale image), the processed binary data with red and blue referring to radial magnetization vectors pointing outside and inside the tube, respectively, are shown.

