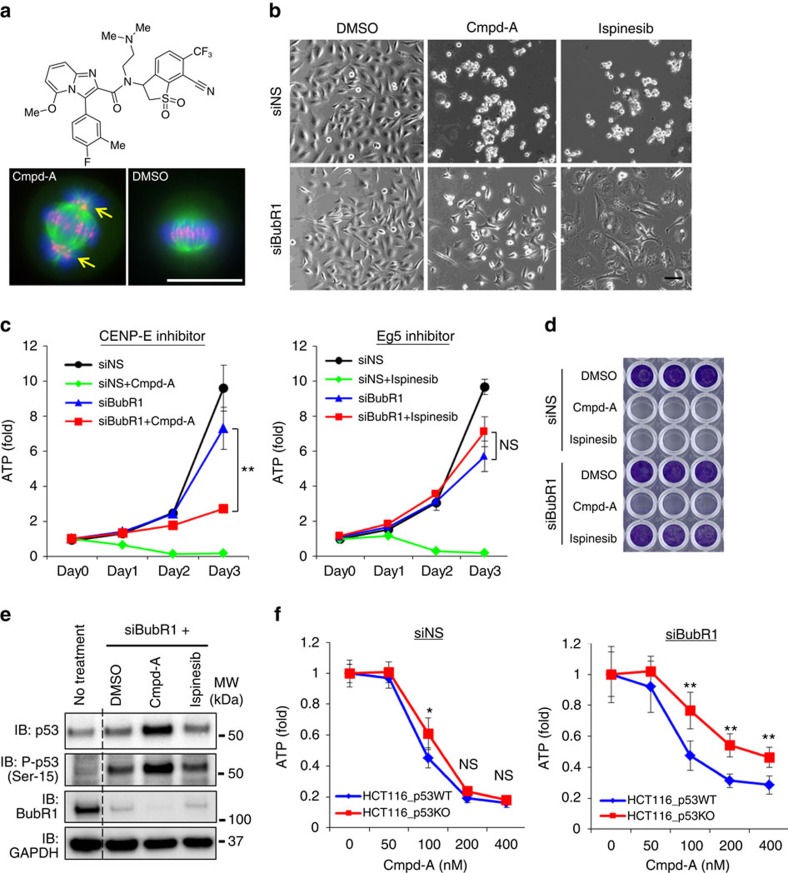
Figure 4. Pharmacological inhibition of CENP-E causes p53-associated suppression of proliferation in SAC-impaired cells but not in SAC-intact cells.
(a) Chemical structure of Cmpd-A (Upper) and misaligned chromosomes in HeLa cells with Cmpd-A treatment (Lower). Green, red and blue signals indicate α-tubulin, CENP-B and DAPI, respectively. Yellow arrows denote the misaligned chromosomes. White bars indicate 20 μm. (b) Phase-contrast microscopy images of siNS- and siBubR1-transfected cells treated with DMSO, Cmpd-A and ispinesib. Twenty-four hours after siRNA treatment, the cells were treated with DMSO, Cmpd-A (200 nM) or ispinesib (10 nM). Images were acquired 48 h after drug treatment. The black bar indicates 100 μm. (c) Anti-proliferative effect of Cmpd-A and ispinesib in siBubR1-transfected HeLa cells. Twenty-four hours after siRNA treatment, the cells were treated with DMSO, Cmpd-A (200 nM) or ispinesib (10 nM) (day 0). Cell growth was evaluated as indicated in Fig. 1b. The line plots represent mean±s.d. (n=3). ATP levels on day 3 were statistically analysed using Student's t-test for comparison between siBubR1+Cmpd-A- and siBubR1-transfected cells and between siBubR1+ispinesib- and siBubR1-transfected cells. Differences were considered significant at P≤0.05 (*) and P≤0.01 (**). (d) Representative images of crystal violet staining in siNS- and siBubR1-transfected cells treated with DMSO, Cmpd-A and ispinesib. Twenty-four hours after siRNA treatment, the cells were treated with DMSO, Cmpd-A (200 nM) or ispinesib (10 nM). Cells were collected 5 days after drug treatment for crystal violet staining. (e) Immunoblotting of p53 and phospho-p53 in siBubR1-transfected HeLa cells treated with Cmpd-A and ispinesib. Cells were collected 48 h after drug treatment. (f) Anti-proliferative effect of Cmpd-A with or without siBubR1 in p53-wild-type and p53-knockout HCT116 cells. Twenty-four hours after siRNA treatment, the cells were treated with Cmpd-A at the indicated concentrations. Cells were collected on day 3 after drug treatment for the ATP assay. Relative ATP levels were calculated based on luminescence in comparison with the luminescence value for 0 nM treatment. The line plots represent mean±s.d. (n=3). Statistical analysis was performed using Student's t-test. Differences were considered significant at P≤0.05 (*) and P≤0.01 (**).

