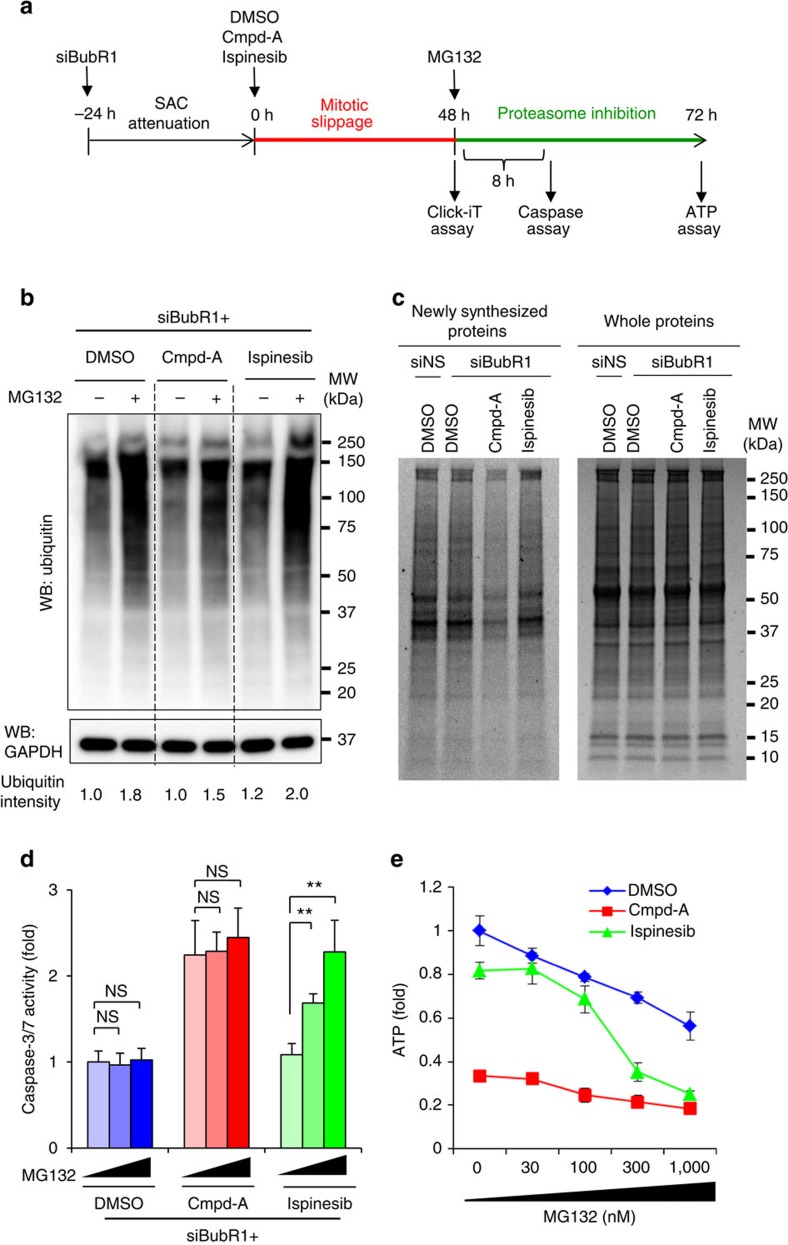
Figure 7. siBubR1+Cmpd-A aneuploid cells decrease global protein translation to reduce the response to the proteasome inhibitor MG132.
(a) Schematics of the MG132 treatment experiments. (b) Global protein ubiquitination by MG132 in siBubR1+DMSO-, siBubR1+Cmpd-A- and siBubR1+ispinesib-treated HeLa cells. (c) Newly synthesized protein in siBubR1+DMSO-, siBubR1+Cmpd-A- and siBubR1+ispinesib-treated HeLa cells. Left and right gels show newly synthesized proteins detected by the Click-iT assay (Life Technologies) and all proteins detected by CBB staining as a loading control, respectively. (d) Effect of MG132 on caspase-3/7 activity in siBubR1+DMSO-, siBubR1+Cmpd-A- and siBubR1+ispinesib-treated HeLa cells. Blue, red and green bars indicate siBubR1+DMSO-, siBubR1+Cmpd-A- and siBubR1+ispinesib-treated HeLa cells, respectively. Relative caspase-3/7 activities were calculated in comparison with the activities in siBubR1+DMSO-treated cells. Statistical analysis was performed using Student's t-test. Differences were considered significant at P≤0.05 (*) and P≤0.01 (**). (e). Effect of MG132 on cell proliferation in siBubR1+DMSO-, siBubR1+Cmpd-A- and siBubR1+ispinesib-treated HeLa cells. Blue, red and green lines indicate siBubR1+DMSO-, siBubR1+Cmpd-A- and siBubR1+ispinesib-treated HeLa cells, respectively. Relative ATP levels were calculated in comparison with those in siBubR1+DMSO-treated cells. Relative ATP levels were calculated based on luminescence in comparison with the luminescence value for 0-nM treatment. The line plots represent mean±s.d. (n=3).

