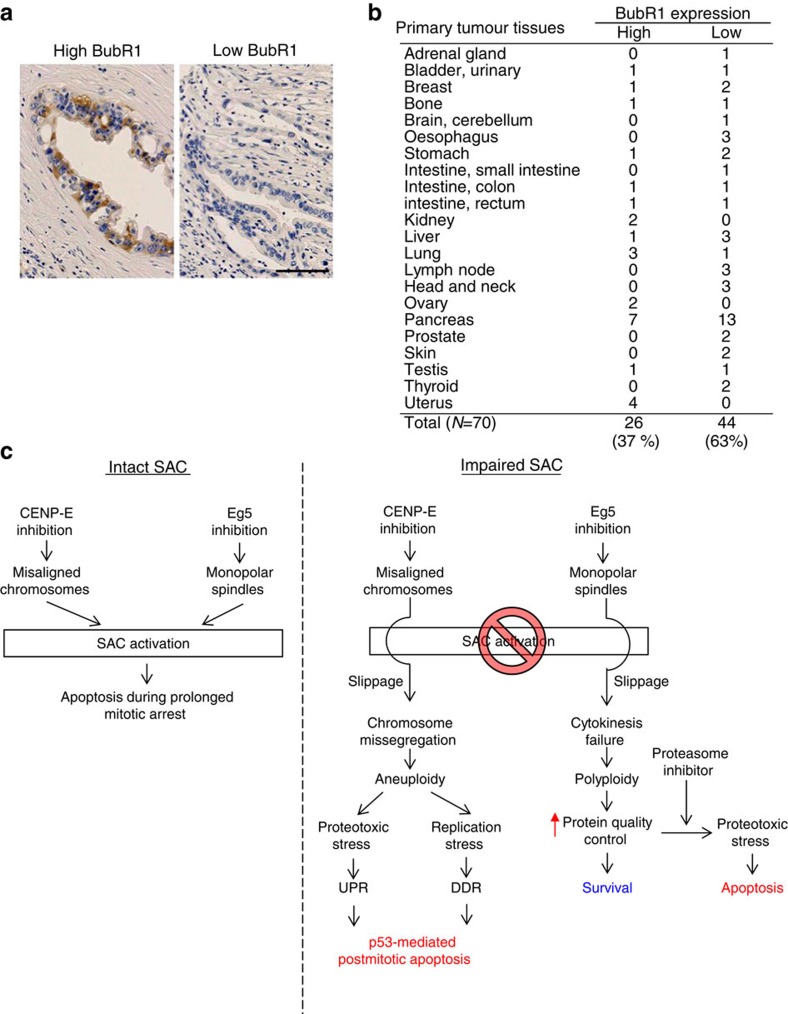
Figure 9. IHC of BubR1 in primary tumour tissues.
(a) IHC of BubR1 in primary pancreatic tumours. The representative images of high (left panel) and low expression (right panel) of BubR1 are shown. The black bar indicates 100 μm. (b) Summary of IHC of BubR1 in 70 different tumour tissues. The tissue microarrays were purchased from BioChain Institute Inc. (c) Schematics of aneuploidy-mediated apoptosis after mitotic slippage.

