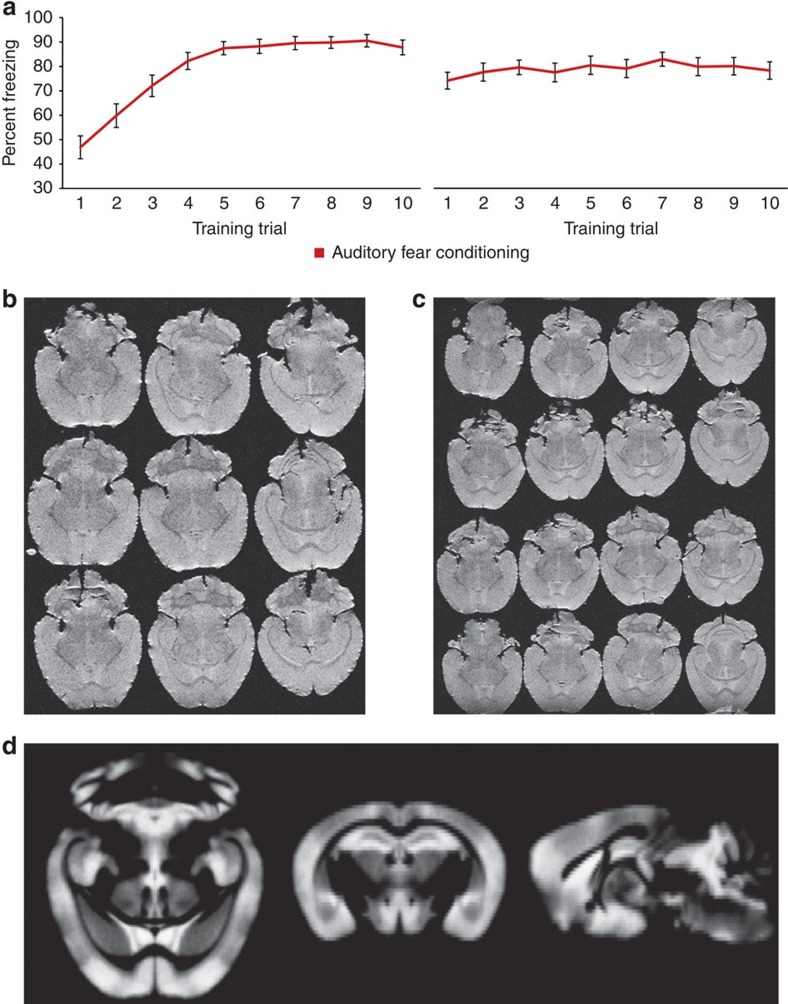
Figure 2. Fear conditioning and high-throughput ex vivo structural MRI.
(a)The two graphs illustrate the acquisition of auditory fear conditioning (illustrated with per cent total freezing during the tone-conditioned cue during each training trial) over the course of 5 days (days 1 and 5 shown). The left graph shows the acquisition of fear during the first day as indicated by the increased freezing behaviour during the presentation of the tone. The right graph shows the freezing behaviour of the group during the last day of training, which has plateaued at ∼80% freezing during the presentation of the tone. (b,c)The middle two images show representative images of the T2 RARE high-resolution ex vivo acquisition of both 9 (b) and 16 brains (c) based on our ex vivo technique. (d)The result of segmenting the grey matter from each mouse MRI volume to create a grey matter skeleton template (n=54 brains) used in the present study.

