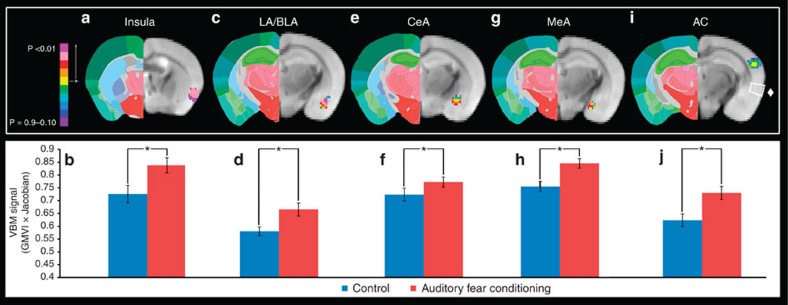
Figure 3. VBM findings in the amygdala, AC and insula.
(a) The results of the VBM analysis showing a significant difference in the insular cortex between the auditory fear conditioning (AFC) and cage-handled control group (n=27auditory fear conditioning, n=27 controls). (b) The bar graphs show the quantification of the VBM signal (grey matter voxel intensity (GMVI) multiplied by the Jacobian) sampled from the voxels of the insular cortex that were significantly different. The analogous data are shown for the LA and BLA in c,d, the CeA in e,f, the MeA in g,h and the AC in i,j, in addition i shows a white box around the rhinal cortex marked by a ♦, which was not significantly different between groups. Data are presented as mean±s.e.m. *P≤0.05.

