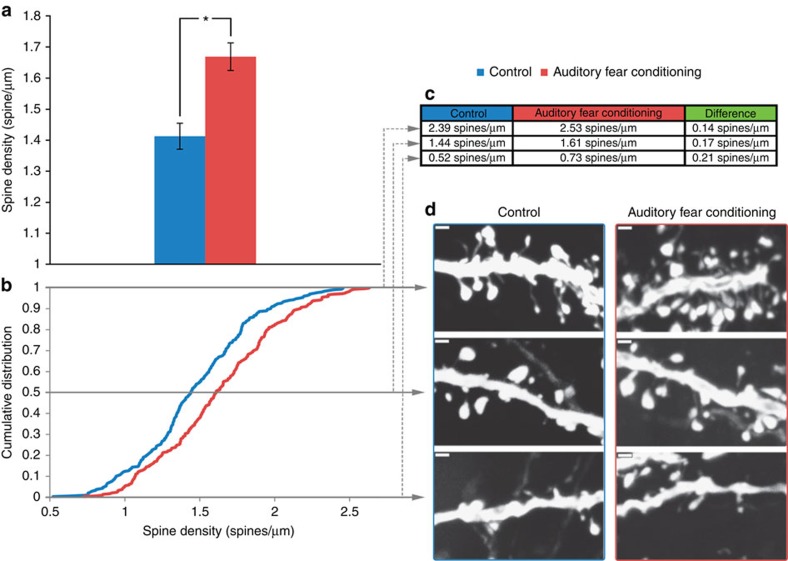
Figure 4. Increased dendritic spine density in the AC.
(a) The bar graph shows the significant difference in average spine density between the auditory fear conditioning group and control from the same brains used for VBM analyses (t-test, n=9 auditory fear conditioning, n=9 control, P=0.013, t16=2.79). (b)The cumulative distribution of the average spine densities for each dendrite length shows a significant rightward shift (higher spine densities across the distribution) for the auditory fear-conditioned group (K–S test, n=290 and 300 for auditory fear-conditioned and control group respectively, P<0.0005, D=0.185). (c,d) The maximum, mid-point and minimum densities of the distribution for the auditory fear conditioning group and control are presented in the table (c) with commensurate confocal images of representative spine densities (d). Data are presented as mean±s.e.m. *P≤0.05. scale bars=1 micrometer.

