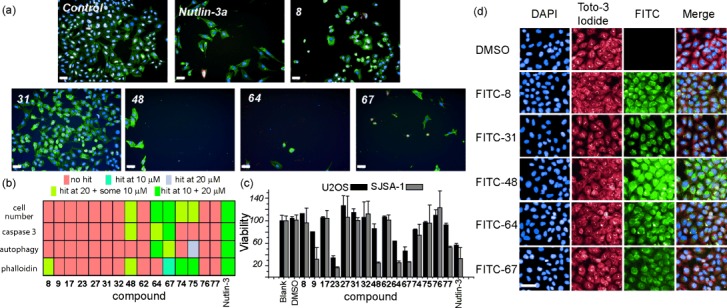
Figure 2.

HCS summary for mimetic library. a) Example images of cells treated with five compounds (20 μm) and controls of 0.2 % DMSO and Nutlin-3a (5 μm) scale=50 μm. DAPI staining is shown in the blue channel, caspase 3 is shown in red, LC3B antibody in yellow, F-actin stained with AlexaFluor488 conjugated phalloidin shown in green. b) Heat map illustrating results of HCS. c) Summary of cellular toxicity of the mimetics added to U2OS (black) and SJSA-1 (grey) cells at a concentration of 50 μm. d) Cells were treated with FITC-labelled trimers and imaged using high-content imaging and co-stained with Toto-3 iodide as a cytoplasmic stain. Scale=50 μm.
