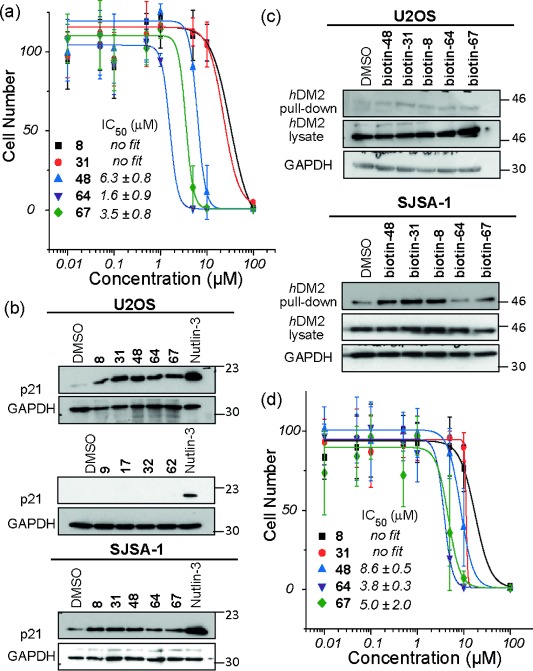
Figure 4.

Cellular response to mimetics. a) Dose-response curves based on analysis of cell number by nuclear staining from U2OS cells treated with different concentrations of mimetics. b) U2OS and SJSA-1 cell lines were incubated with mimetics (50 μm) or Nutlin-3 (10 μm) for 4 h and lysates analyzed by western blotting for p21 and GAPDH. c) U2OS and SJSA-1 cells were treated with biotinylated mimetics (10 μm) for 4 h and cell lysates were subjected to Streptavidin pull-down followed by analysis by western blotting for hDM2. d) Same as for (a) except for the use of Saos-2 cells.
