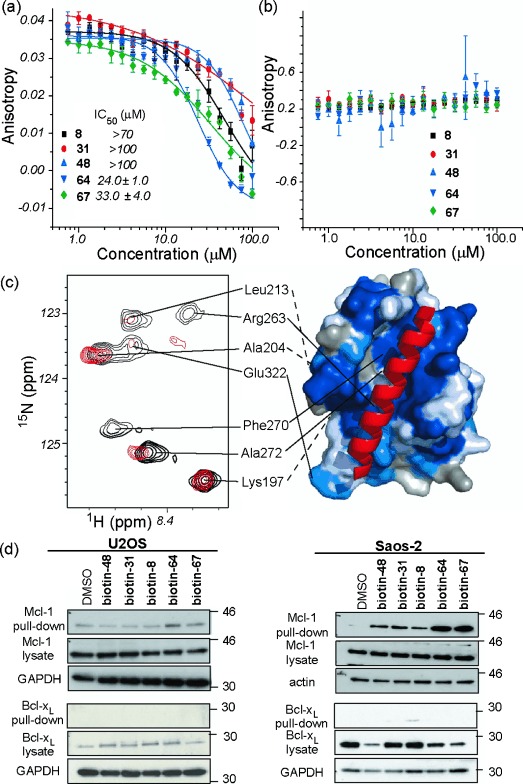
Figure 5.

Bcl-2 family binding properties of mimetics. Dose-response curves of the inhibition of the a) Mcl-1/NOXA-B and b) Bcl-xL/BAK interactions measured with fluorescence anisotropy. c) 1H-15N HSQC spectra of 15N-labelled Mcl-1. Spectra recorded in the absence (in black) and presence (in red) of 64. Crosspeaks that move or change in volume are mapped onto the surface of Mcl-1 and shown in blue. d) U2OS and Saos-2 cells were treated with of biotinylated mimetics (10 μm) for 4 h and cell lysates were subjected to Streptavidin pull-down followed by analysis by western blotting for Mcl-1 or Bcl-xL (GAPDH or actin used as loading controls).
