
Table 1.
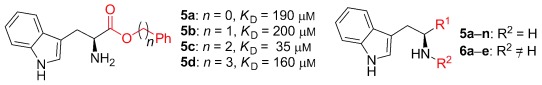
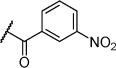
SAR for tryptophan ester series binding to HumRADA2 (ITC)
 | |||||
|---|---|---|---|---|---|
| Compd | R1 | R2 | LE[a] | LLE[b] | KD [μm][c] |
| 1 |  |
H | 0.28 | 1.9 | 570[23] |
| 2 |  |
H | 0.24 | 2.2 | 1500±24 |
| 3 | |
 |
0.22 | 2.0 | 810±19 |
| 4 | |
|
0.22 | 2.6 | 890±15 |
| 5 a |  |
H | 0.24 | 0.7 | 190±5 |
| 5 b | 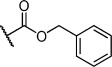 |
H | 0.23 | 0.7 | 200±8 |
| 5 c | 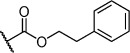 |
H | 0.26 | 1.1 | 35±4 |
| 5 d |  |
H | 0.22 | 0.02 | 160±7 |
| 5 e | 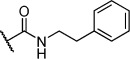 |
H | – | – | >200 |
| 5 f |  |
H | 0.26 | 1.1 | 25±5 |
| 5 g | 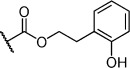 |
H | 0.26 | 1.5 | 27±12 |
| 5 h |  |
H | 0.26 | 0.7 | 30±9 |
| 5 i | 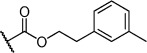 |
H | 0.26 | 0.7 | 30±7 |
| 5 j | 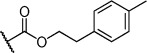 |
H | 0.26 | 0.8 | 22±4 |
| 5 k | 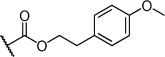 |
H | – | – | >200 |
| 5 l |  |
H | – | – | >200 |
| 5 m | 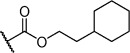 |
H | 0.27 | 0.8 | 28±9 |
| 5 n | 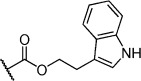 |
H | 0.23 | 1.0 | 35±9 |
| 6 a | |
 |
0.24 | 0.5 | 3±1 |
| 6 b | |
|
0.25 | 1.5 | 18±1 |
| 6 c | |
 |
– | – | >200 |
| 6 d | |
 |
– | – | >200 |
| 6 e | |
 |
– | – | >200 |
[a] Ligand efficiency (kcal mol−1 per heavy atom). [b] LLE=pKD−clog P; clog P was calculated with Instant JChem (ChemAxon). [c] Estimated errors in KD are given, generated by fitting a single-site binding model (Origin software version 7.0552).