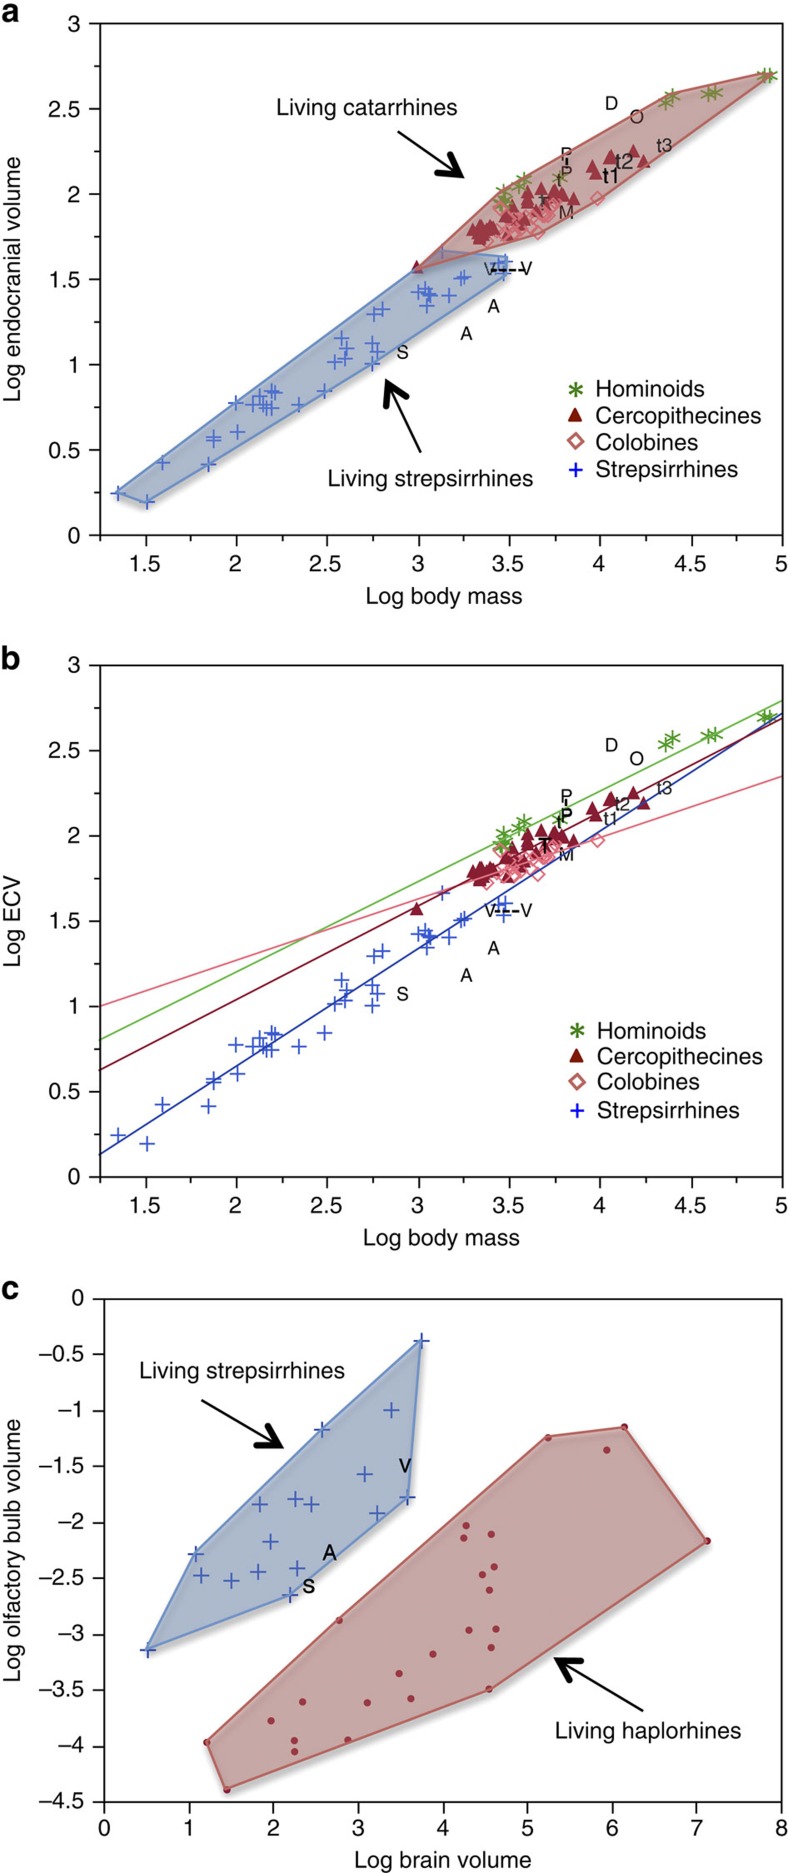
Figure 2. Analysis of the brain and olfactory bulb size.
(a) Bivariate double logarthmic plot of ECV in cm3 against body mass in g for extant strepsirrhines and catarrhines from Isler21, with data superimposed for Victoriapithecus (V), Oligocene Simonsius (S)22 and Aegyptopithecus (A)23; Miocene hominoids Proconsul (P)24,25,26,27, Turkanapithecus (T)25,26, Dryopithecus (D)25,26,28, Oreopithecus (O)25,26,29,30,31,32,33; the Miocene colobine Mesopithecus (M)5,18; Plio-Pleistocene cercopithecines T. darti (t1)18,35, T. brumpti (t3)35,36; and T. oswaldi (t2)18,35,37,38; and extant T. gelada18,35. Maximum convex polygons are fit to species means. (b) Ordinary least squares regressions for strepsirrhines, colobines, cercopithecines and hominoids using the data in a. (c) Double logarithmic plot of olfactory bulb volume against brain volume for extant primates43,45 and Victoriapithecus. Brain volume data for V, S22 and A23 are represented by ECV in cm3. Olfactory bulb volume for fossil specimens is represented by olfactory fossa volume in cm3 with maximum convex polygons fit to species means.

