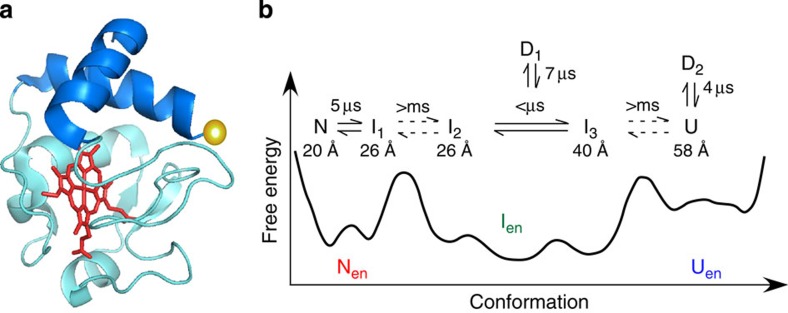
Figure 7. Conformational transition of cytochrome c.
(a) Native-state structure of cytochrome c (PDB ID:1YCC). N- and C-terminal helices are highlighted with blue. The position of the donor dye is shown by a yellow sphere. (b) Schematic free energy landscape and relevant conformational dynamics of cytochrome c (pH 3.5). The equilibration times among conformers and the donor–haem distances evaluated in the present work are given.

