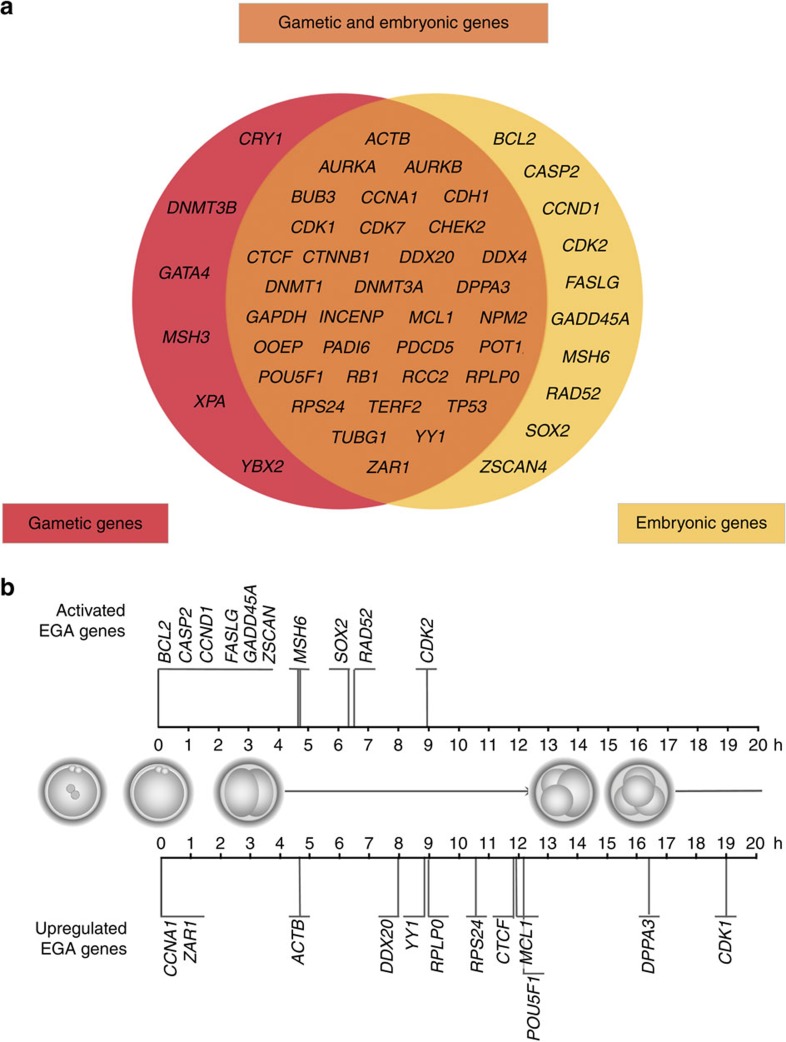
Figure 4. Identification and timing of gametic versus embryonic transcripts.
(a) Gametic transcripts (n=40) were highly expressed at time zero, whereas EGA genes (n=44) were highly expressed at the final time point. The majority of these genes (n=34) were originally inherited from the gametes and subsequently activated by EGA. (b) EGA timing is shown in hours (h) after PNd. Two groups were identified according to the basal levels at the pronuclear stage: ‘Activated EGA genes' (n=10) that were originally absent at the zygote stage corresponded to Cluster 3 genes and ‘Upregulated EGA genes' (n=12) that were already present at the pronuclear stage were designated for Cluster 4 genes. A schematic representation of embryo development with normal mitotic divisions was included as a guide.

