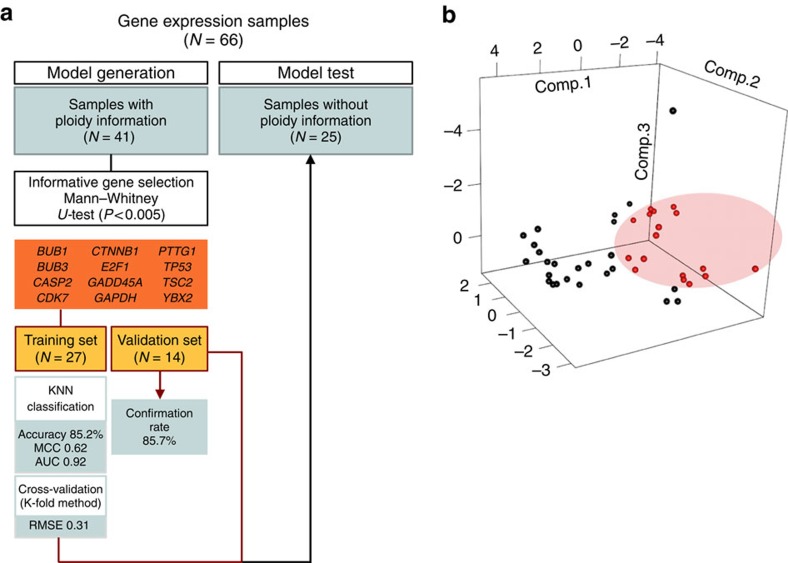
Figure 6. Embryo ploidy prediction model.
(a) A diagram of each phase of the ploidy prediction model. All samples with gene expression data were used in this process. Samples with ploidy results were selected for model generation and validation. Samples without ploidy information became the prediction group. MCC, Matthews correlation coefficient; AUC, area under the curve; RMSE, root mean squared error. (b) Principal component analysis of cells (n=41) from embryos at early stages (before 30 h post PNd) on the basis of the expression of the 12 genes selected in the prediction model. Cells from euploid embryos are shown in black (n=25) and samples from aneuploid embryos are designated red (n=16).

