
Figure 2.
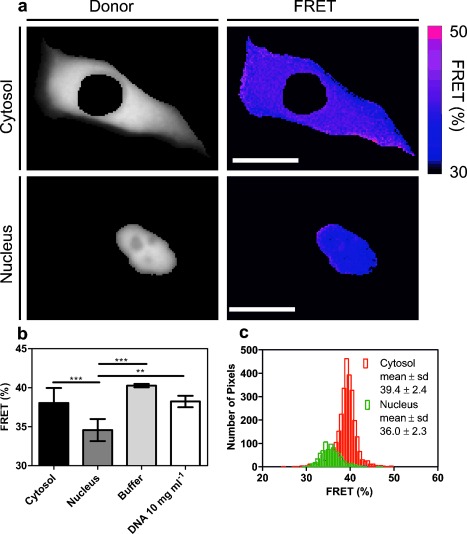
a) Representative donor (Atto488) images of cytosolic and nuclear injected cells. Further, false-colored images of FRET efficiencies calculated for each pixel are shown. Scale bar: 20 μm. b) Comparison of the mean FRET efficiencies in HeLa cytosol (n=17), HeLa nuclei (n=11), 10 mg mL−1 DNA solution (n=3), and diluted buffer (n=3). One-way ANOVA with multiple comparisons and a Tukey’s post-test were used to determine statistical differences. *P<0.05, **P<0.01, ***P<0.001. The data are reported as mean ±s.d. c) FRET efficiency histogram of the cytosol and nucleus.