
Figure 1.
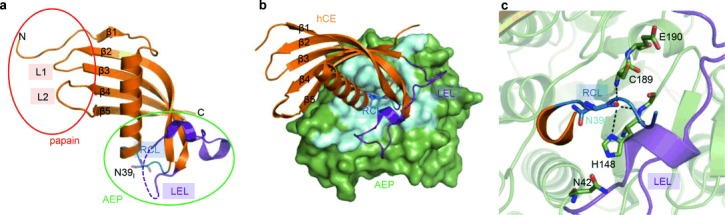
Crystal structure of human cystatin E (hCE) alone and in complex with legumain. a) Papain and AEP inhibitory sites are indicated by a red and green circle, respectively. The papain-interacting region is composed of the N-terminus and loops L1 and L2, the AEP-interacting region by the reactive center loop (RCL) harboring Asn39I and the legumain exosite loop (LEL). b) The interaction of cystatin E (hCE, orange) with AEP (green) is mediated by the RCL (dark blue) and the LEL (purple). The AEP–hCE interaction surface is colored light blue. c) Enlarged view of the AEP active site reveals substrate-like binding of the cystatin RCL. Catalytic residues are shown as green sticks, Asn39I as blue sticks.